Data Collection and Analysis

Introduction
This page provides a documentation of my journey in the third fortnight and the second week of the second fortnight. The weeks' reflection highlights an introduction to the PM2.5 air quality sensor, data and the data collection standards; data creation, collection, questioning and exploration. It also highlights my attempt to combine 2 air quality datasets (one collected by us and the other by the ACT Government).
Prior to this fortnight, I had never collected air related data and had only learned data wrangling and visualization using Python, Microsoft Excel, and Tableau at Udacity in 2018. I hadn't really used these skills because I worked as a full-time software developer. I thought I was prepared for the coming activities; little did I know what was coming. The following activities led me into questioning how data is collected, data integrity, and how I question data.
Learning Resources
The skills session was preceded with learning about data, data collection process, PM2.5 Air quality sensor, and air quality definition and standards from reading these resources:- Conceptualising Data from The Data Revolution: Big Data, Open Data, Data Infrastructures & Their Consequences - SAGE by Kitchin, 2014
- Bias in Computer Systems by Friedman and Nissenbaum, 1996
- PM2.5 Air Quality Sensor documentation and use cases
- ACT Health advice for smoky air (PM2.5) here
- Air Quality Units of Measurement here
Key Skills and Components
- Jumper wires
- PM2.5 Air Quality Sensor
- Breadboard
- Adafruit Circuit Playground Express board
- USB cord
- Code Editor: Mu Code
- Tableau Desktop
- Python
Activities
Collecting Air Quality Data
This activity began with an introduction to air particles and air quality measurement, followed by an introduction to the PM2.5 air quality sensor and how it detect the air particles. Afterwards, we were paired and was asked to use the sensor and a sample code we were provided with to log the air quality data of 3 different environments of choice in an excel sheet. We decided to collect the data of the classroom, a cafe shop and the ANU campus sport field as seen below. We were able to successfully connect the PM2.5 to our computer by first reading its wiring guide.

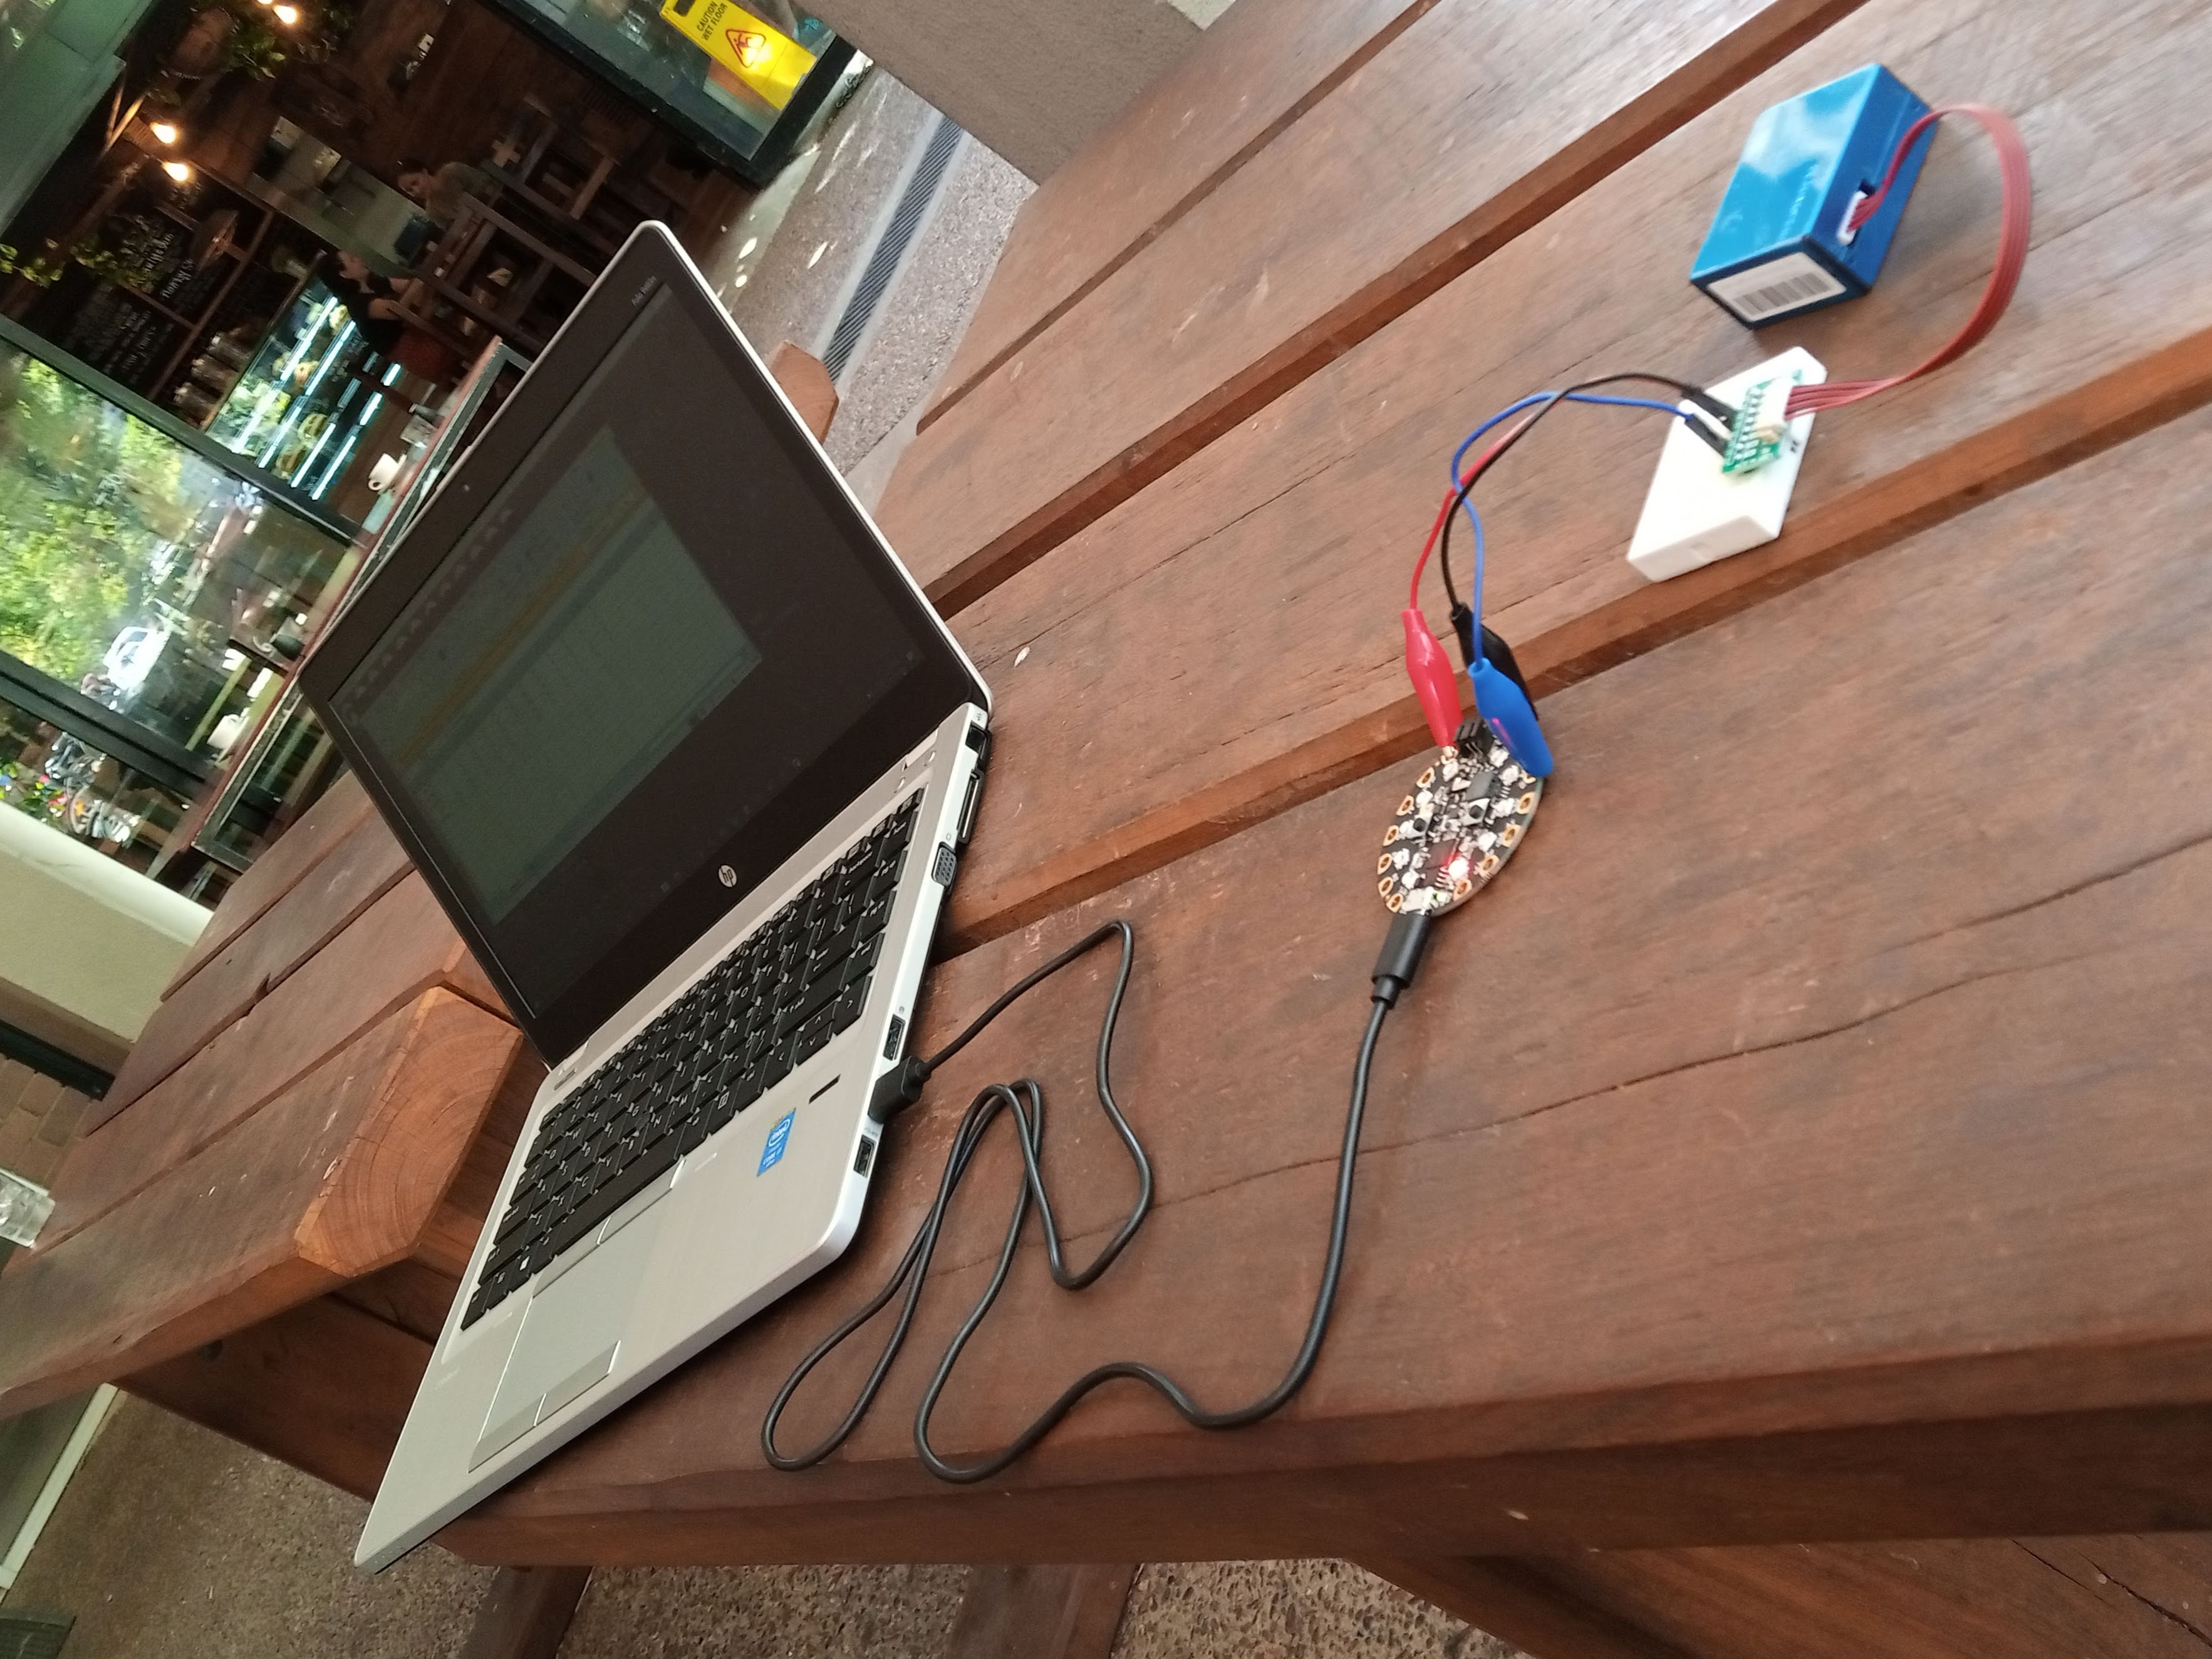
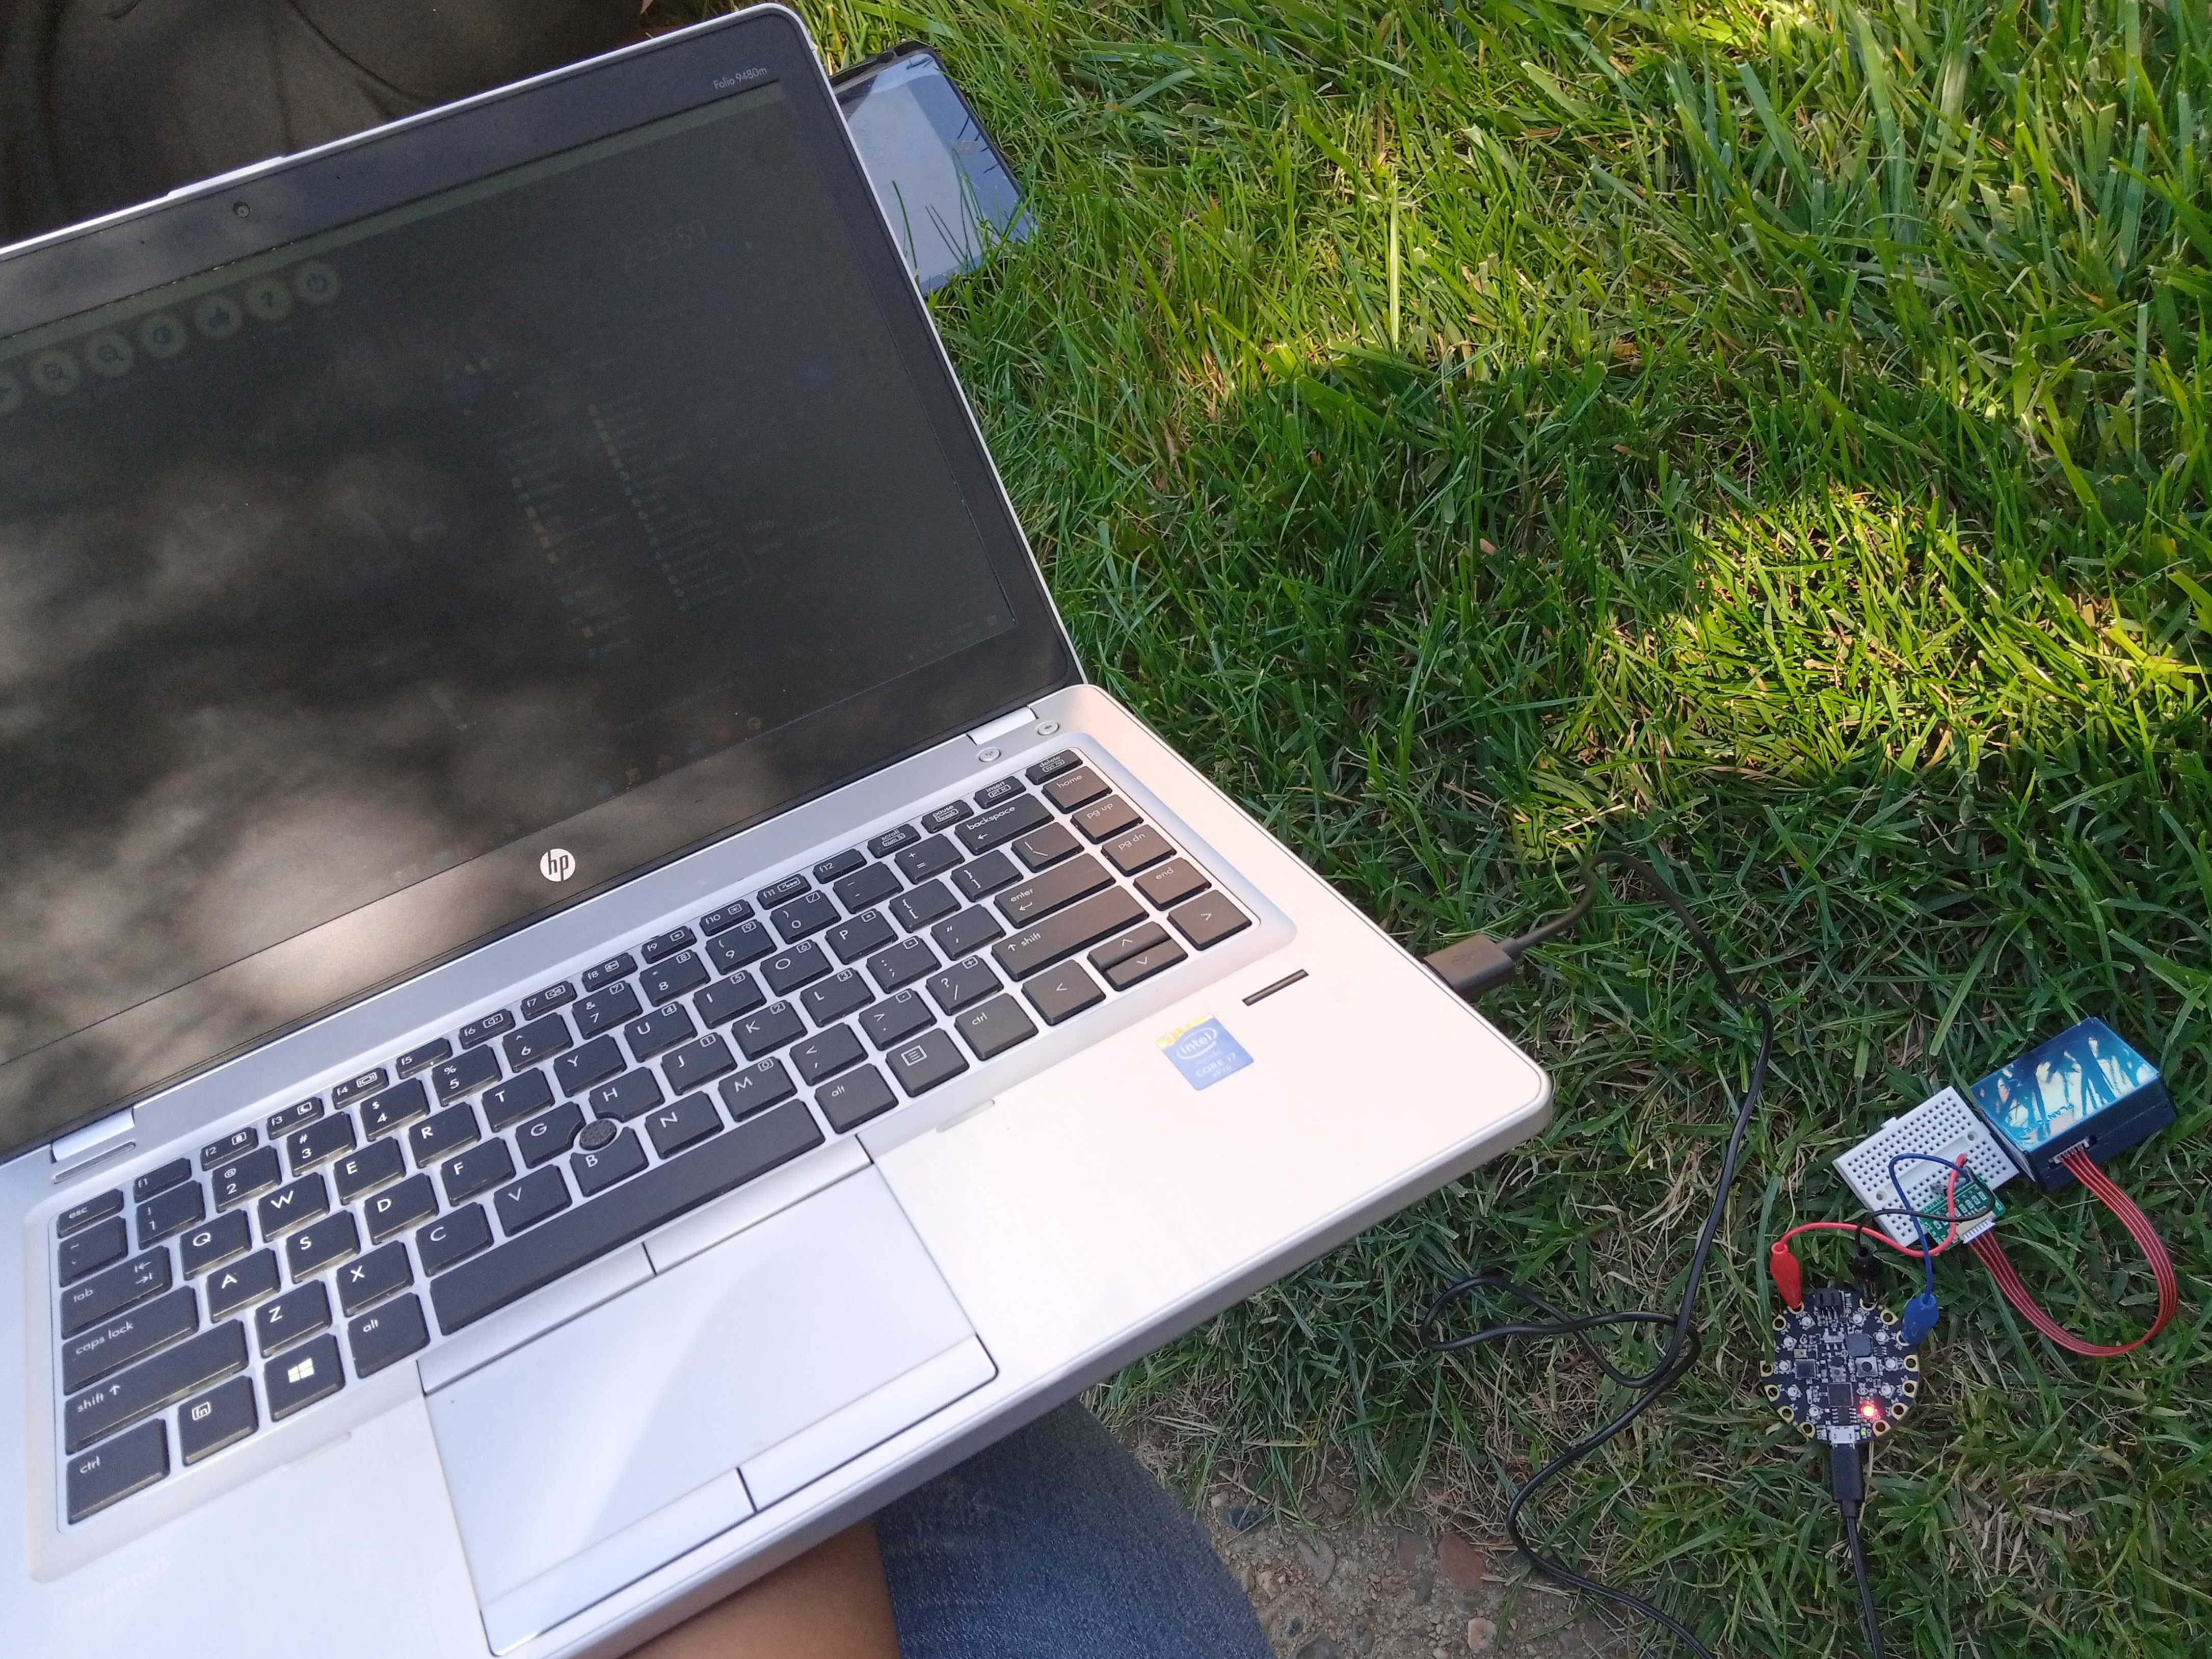
In order to record the locations of the collected air quality data in the sheet, we noted the start and end time of collecting the data, including the number of rows of data collected at the stop time for each location in a jotter. The locations of these data were manually filled into the excel sheet afterward by using the noted start time, end time, and number of data entries to trace the data collected in each location.
Explored and Questioned COVID-19 data
This was short a activity in the 5th week of the semester. This activity involved picking any COVID-19 related public dataset of choice and questioning their sources and reliability. I questioned Nigeria's record of her COVID-19 cases sourced from the Nigeria Centre for Disease Control (NCDC). The dataset can be found here. I questioned the data based on what I had learned so far (from reading Kitchin's Conceptualising Data) about data collection process and how it can be influenced by:
- the person collecting the data - their experience, assumptions, and aspirations
- the data measurement tools used
- the environment where the data was collected
- the limitations of the data storage and management infrastructure
- politics involved in collecting the data - what/who was included and omitted? why was the data collected?
- the story of the data - its history, context, intent, limitations, how it has evolved, etc.
The activity was a short but really interesting one. It opened my eyes to the essence of examining data and how our prior knowledge and assumptions about the data and its locale can influence how it is questioned and interpreted. It also showed the importance of meta-data and how limiting that can be - what is missing in the meta-data? how reliable are meta-data?
Analyzing and Combining Datasets
This activity began with downloading ACT's air quality data from the ACT Open Data Portal, reading its meta-data and importing it to Tableau for exploratory data analysis (the data contains data from the air quality data collection centers in Civic, Florey, and Monash). This was followed by exploring the data in Tableau to see if the columns have the correct data type (based on their description in the meta-data), and also looking into what columns can be further split or transformed to get atomic and relevant values. The columns were transformed (converted to the right data type, split composite data), renamed columns with more descriptive names) to forms that can be visualized in Tableau. The transformed data was mapped using plots, charts and maps.
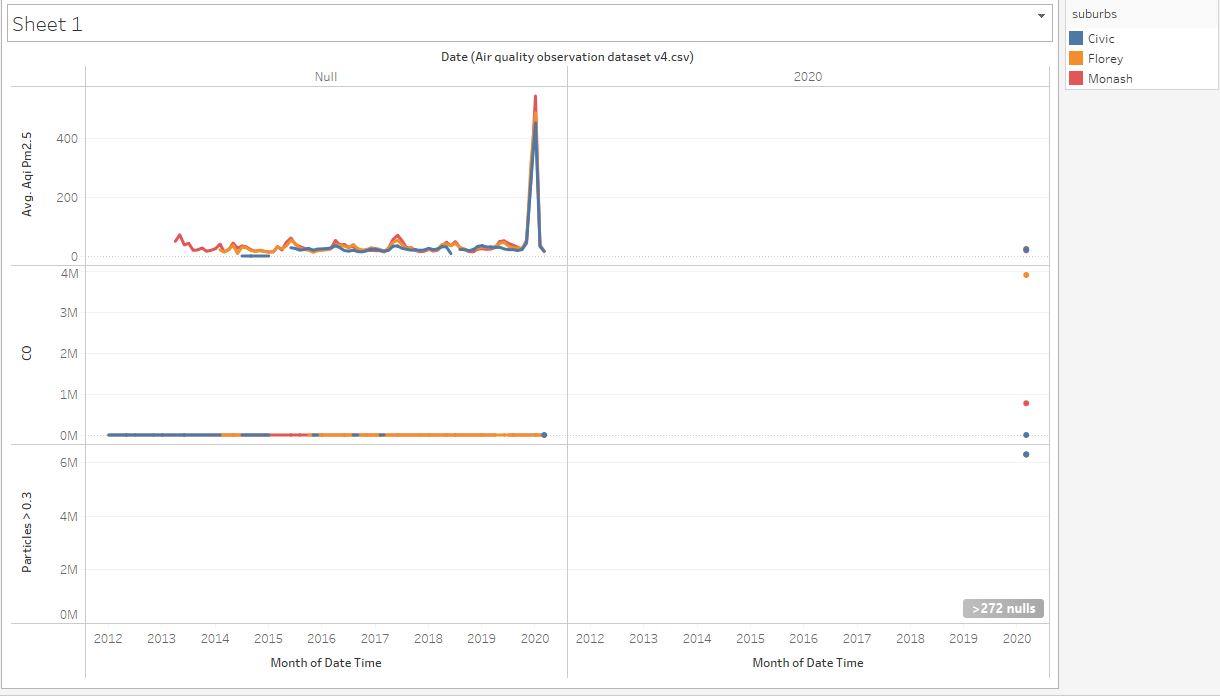
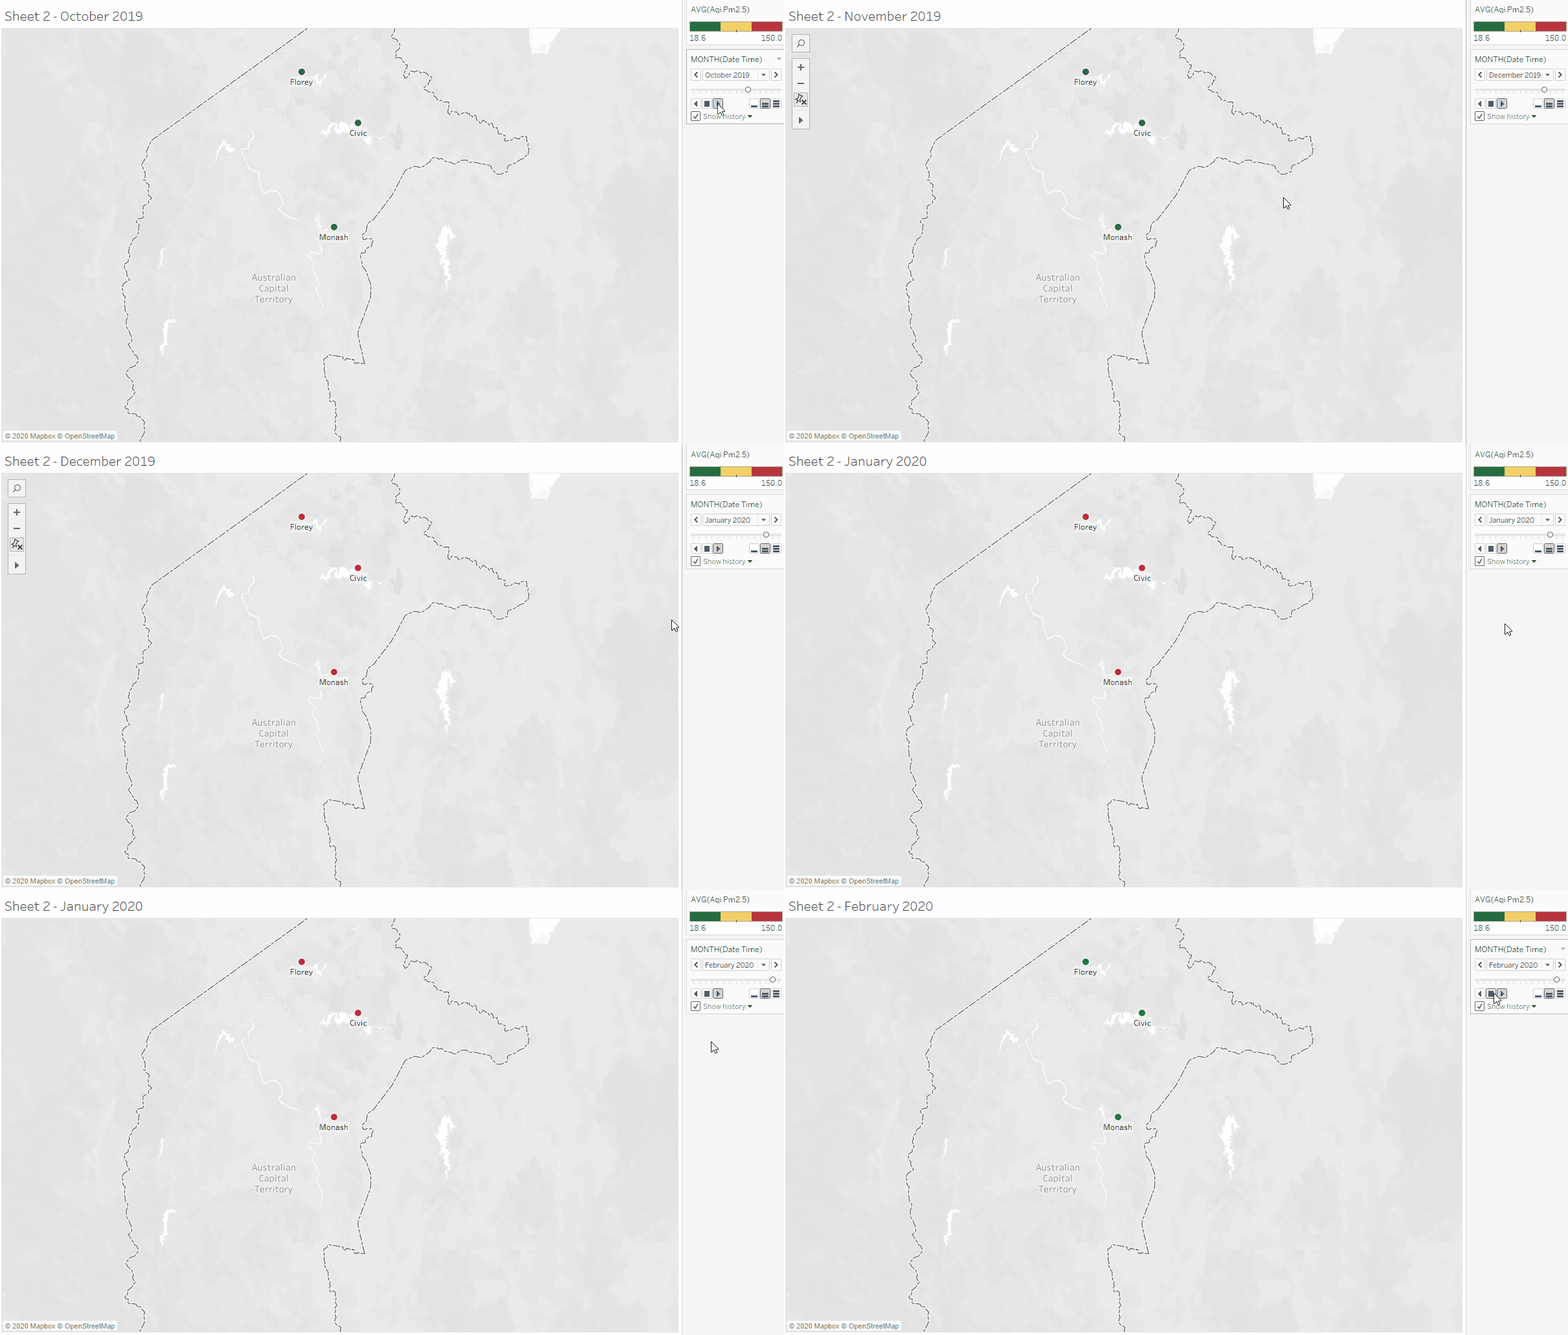
To explore further, I attempted to combine the ACT data with the data we collected using PM2.5 sensor. No matter how much I tried, I couldn't combine them because the format in which our data was recorded was different from ACT's. This made me reflect on the importance of having a shared standard for collecting related publicly available data.
Creating a Public Data Collection and Monitoring Application
This was a grouped class activity that involved designing a air quality alert application that is based on a real-time air quality monitoring and collection system. The collected data will influence critical decisions to be taken about the masses and their well-being. On a long-term, it could economically empower or handicap communities. Having this in mind, we had to critically think about:
- the factors to consider in designing this system.
- what data should be collected to aid our decisions.
- who is affected directly and indirectly? and what data about them do we want to collect
- what expertise will be needed to build this system at scale
- how do we ensure we have developed a fair system - how do we define "fairness"? how transparent will the system be? how do we know what data require seeking user consent? what data should we not collect?
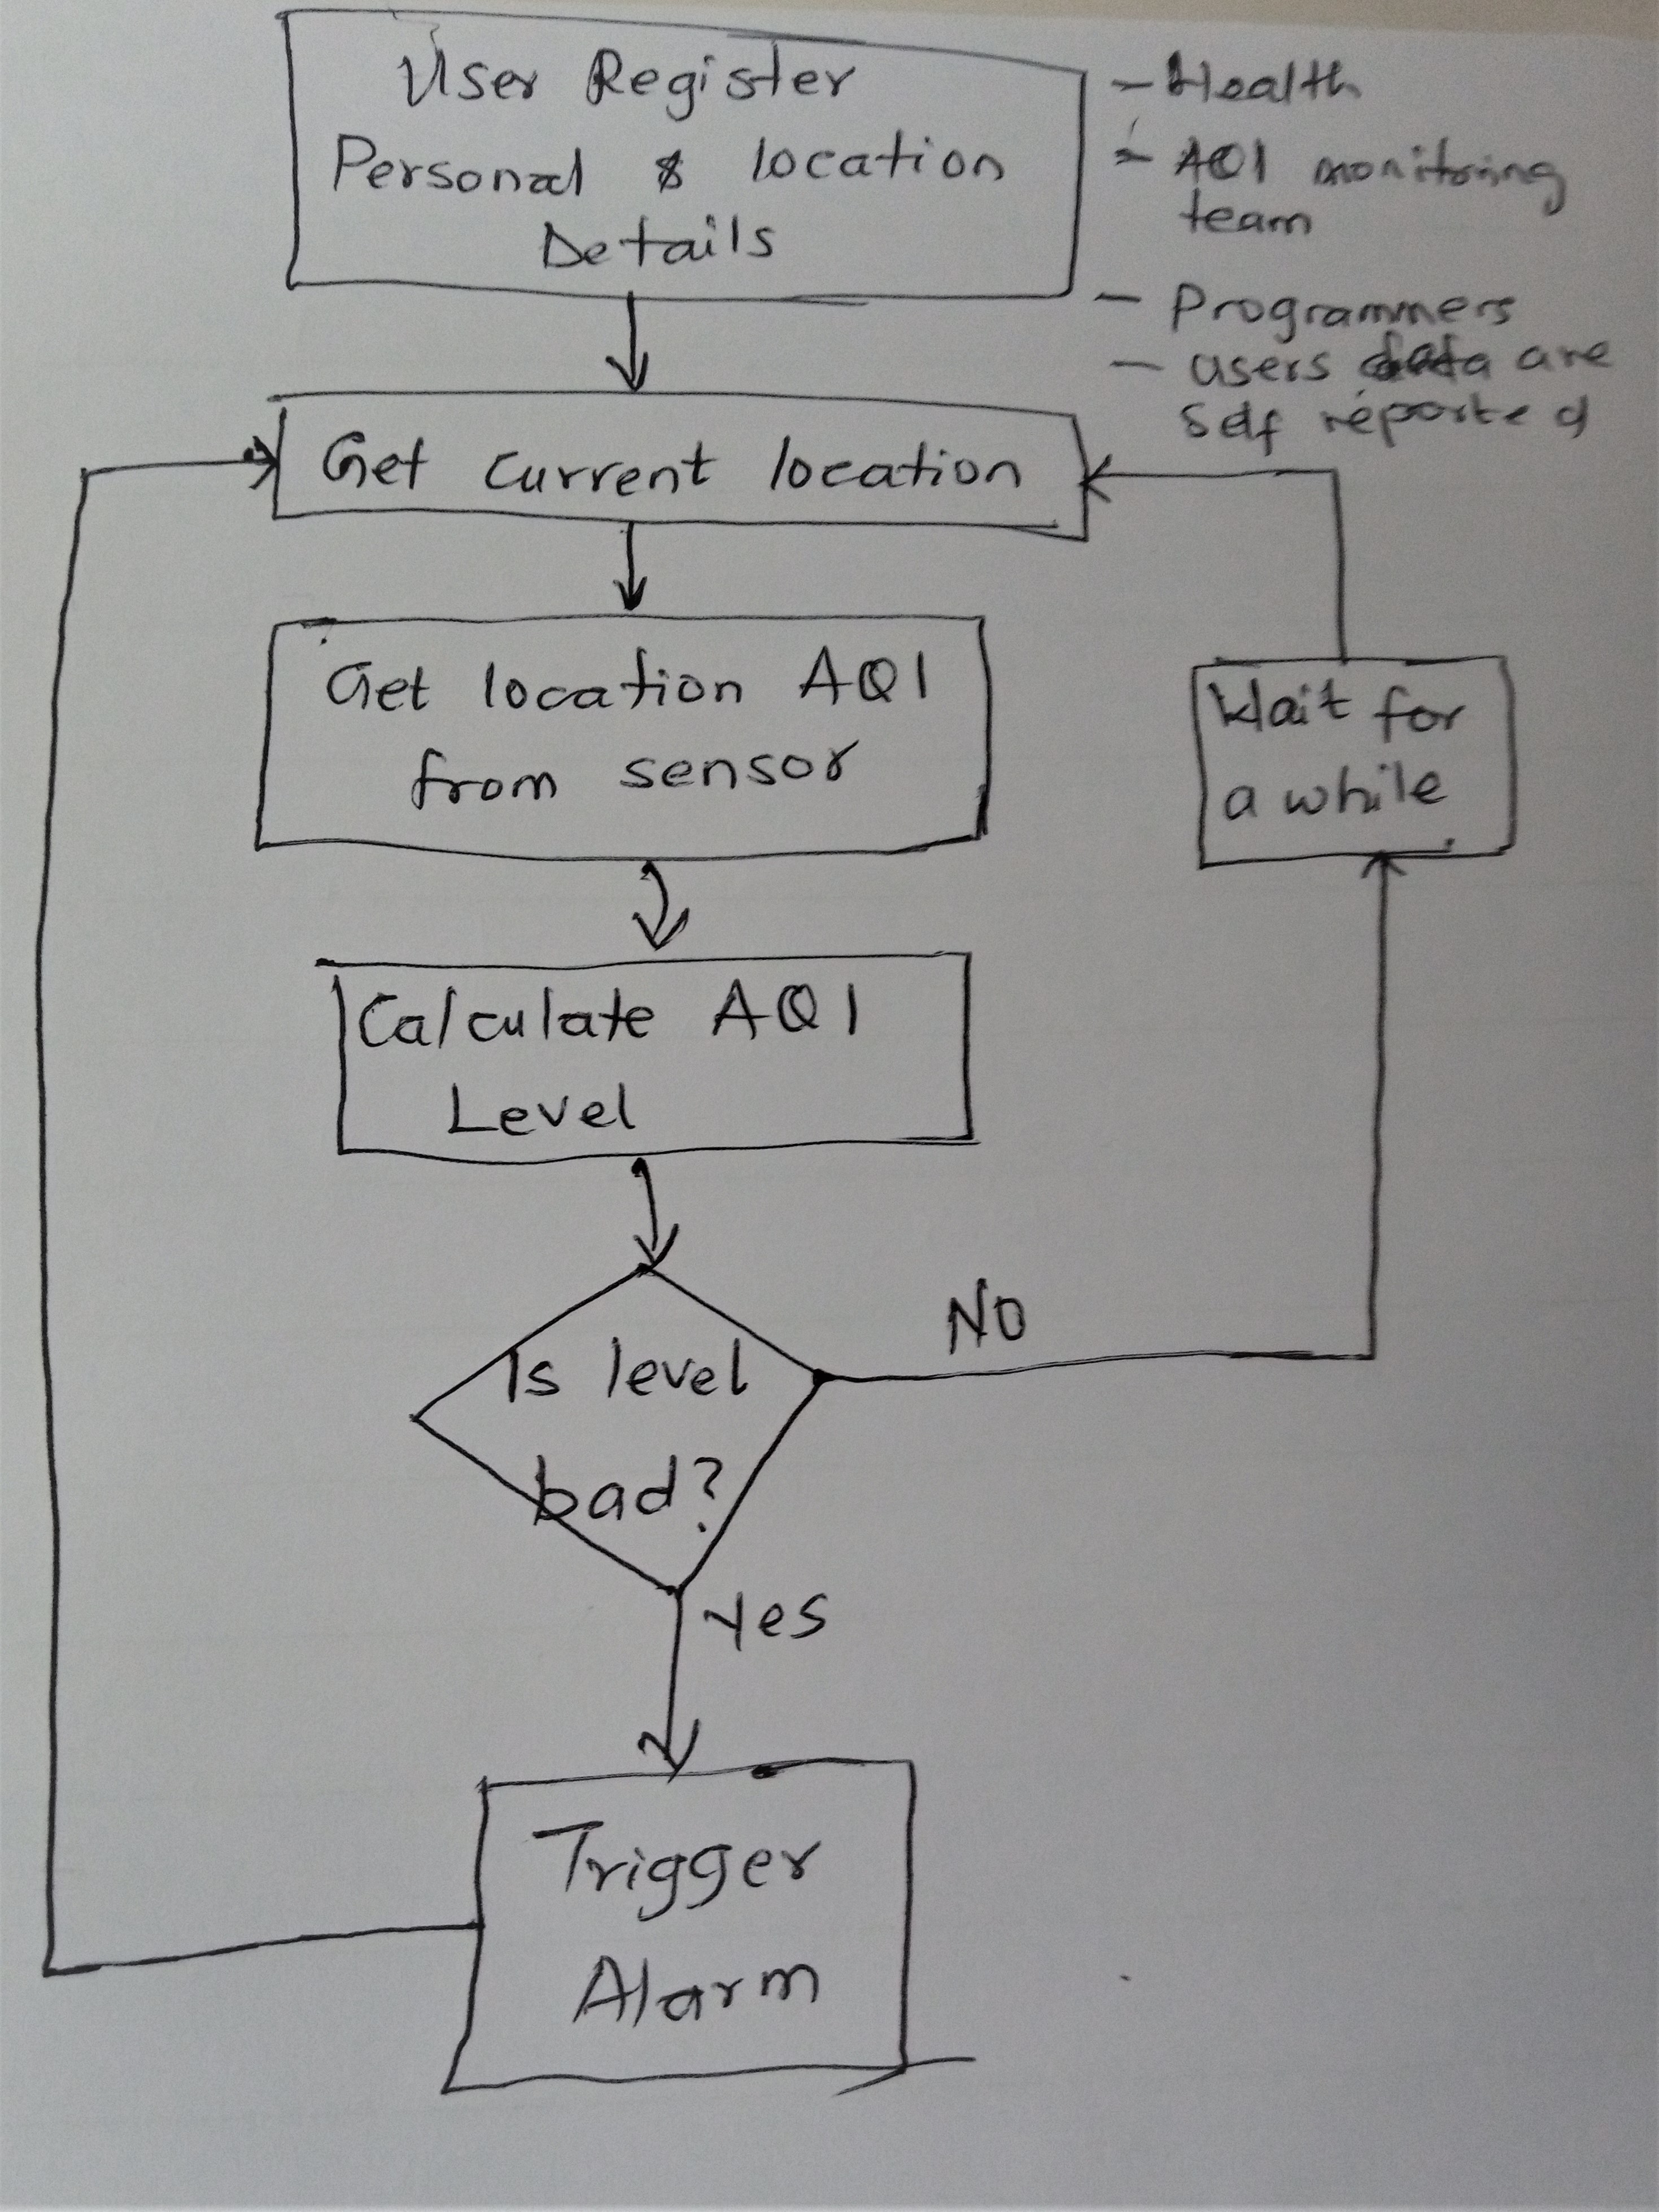
This activity opened my eyes to the questions we need to ask when we collect data, and how the data we "collect" can result in loss of economic opportunity for some (marginalised) group(s). It made me reflect on what actors are considered when creating public applications - how do we decide who and what to factor in? how do we decide who and what should be prioritized? how does knowing where our data could be used changed the conversation we have and the questions we ask? how do we develop ethical social systems - how do we define ethics without being biased or blinded by assumptions?
Challenges and Solutions
-
Combining the ACT and our air quality data: The thought of combining both air quality datasets for comparison and exploration was easy and exciting, until I attempted it. The structure of the ACT data table was completely different from ours, making them almost impossible to join together. I attempted renaming and transforming some of our data columns so they'd be similar to ACT's, it still couldn't eliminate the discrepancies.
Solution: This made us realize the importance of having a shared standard for collecting public data or publicly available data. Also, had it been we collected our data with the intent of combining it with ACT data, we might have collected it differently and optimized the data for the purpose.
-
Deciding whose data should be collected and whose shouldn'te: during the data application design exercise, having reflected on how impactful the data collected could be, it was really difficult to decide if we have considered every relevant party. Our knowledge is limited, we can only reason based on experiences and backgrounds - working on this activity with a diverse team reflected this. How do we know our data is diverse enough? How do we determine whose data is "relevant and worthy" of being captured? How do we know our assumptions about "diversty" is not wrong? How do we know when we're assuming and question our assumptions? How do we know our data is ethical!?
-
Exploring data objectively: it was tricky to explore data from known sources or locale objectively with no assumptions or expectations of analytics result. This is my observation during the COVID-19 dataset exercise and I am consciously working managing my assumptions and expectations during analytics.
Takeaway Lessons
- Our assumptions and aspirations can influence and shape how we collect and question data, it is essential to assume an objective role when collecting and questioning data.
- Data analysis and questioning isn't really about how well I can wrangle or manipulate data to get what I want, it requires learning about the data from the dataset and its story - asking the right questions that results in probably uncovering the unexpected.
- It is important to have a detailed data documentation or meta-data that includes its history, content, intent, scope, and how it was collected; the tools used in collecting it, data limitation - who or what was included and wasn't.
- Having a shared standard for collecting similar public data makes it easier to combine related data. Note that it can be a limitation on the collected data.
- Efforts should be made in collecting tidy data (has the right data type, descriptive variable names, appropriate values), it saves time during analysis. Data should be optimzed for future use by other people aside the data collector.
- I should always transparently document and communicate my analytics steps - what changes were made and why, for future reference
- The importance of collecting diverse data cannot be overemphasized - the negative consequences of intentionally or unintentionally omitting some groups when collecting data for a diverse use can be unprecedented.
Achievement
At the end of the activities, I:- Collected raw air quality data.
- Understood the process of collecting raw data, preparing and cleaning them for further use
- Learned the importance of setting data collection standard from my inability to combine the air quality datasets.
- Learned how to understand and question data, and its integrity or reliability based on what was documented in the meta data (and outside it).
- Wrangled and visualized data using tableau.
- Unlearned and relearned data collection and anaysis processes - I still have lots of questions on ethical data collection and analysis. How do we define ethics? Who defines it?