Safety and Assurance in Systems
Introduction
Brand (1999) stated that the living has never had as much great impact on the unborn as we currently do, and because of the delay between our actions and its effects, we might not understand nor experience the impacts of our activities. Currently, technological growth is at its highest pace and its driving growths in order key areas like culture, economy, etc. As cybernetic engineer, it is key to design systems sustainably for nature and humanity, in order to avoid consequential impacts on the future generation. One of the approaches for assuring safe and sustainable design is risk assurance and governance mapping.
In this activity, I performed risk analysis on two CPS systems - The Aviary and Powerpuggle - in development in collaboration with Ashita to determine how to design them to be safe and sustainable systems at scale. I played 2 different roles in the analysis of the systems - I was a system expert when we analyzed The Aviary and a system analyst when we analyzed Powerpuggle. At the end of our conversation, we designed CPS lifecycle governance map of risk, stakeholders and oversight for each CPS.
This page provides my notes and reflections on working on both systems and exploring from different perspectives as I took on different roles in the analysis process. It documents my activities working as an Aviary system expert and Powerpuggle system analyst. Only the governance map of Powerpuggle will be discussed in this piece.
Since this piece was written for the Build instructors, with the assumptions that they have background knowledge on the systems, I left out the details about the systems.
Achievement
During the activities, I:- Perform system and risk analysis on Powerpuggle
- Anticipate potential risks on the system at different phases of the system's lifecycle
- Communicated my CPS system using system mapping
- Created error forms to communicate and contextualize each anticipated errors
- Created a governance map to recommend ways to steer key decisions about the system through its lifecycle
Key Skills and Methods
- System analysis
- Stakeholder analysis
- System mapping
- Risk analysis
Activities
Kindly note: The risk assessment was performed in collaboration with AshitaMapping the system and communicating as a System Expert
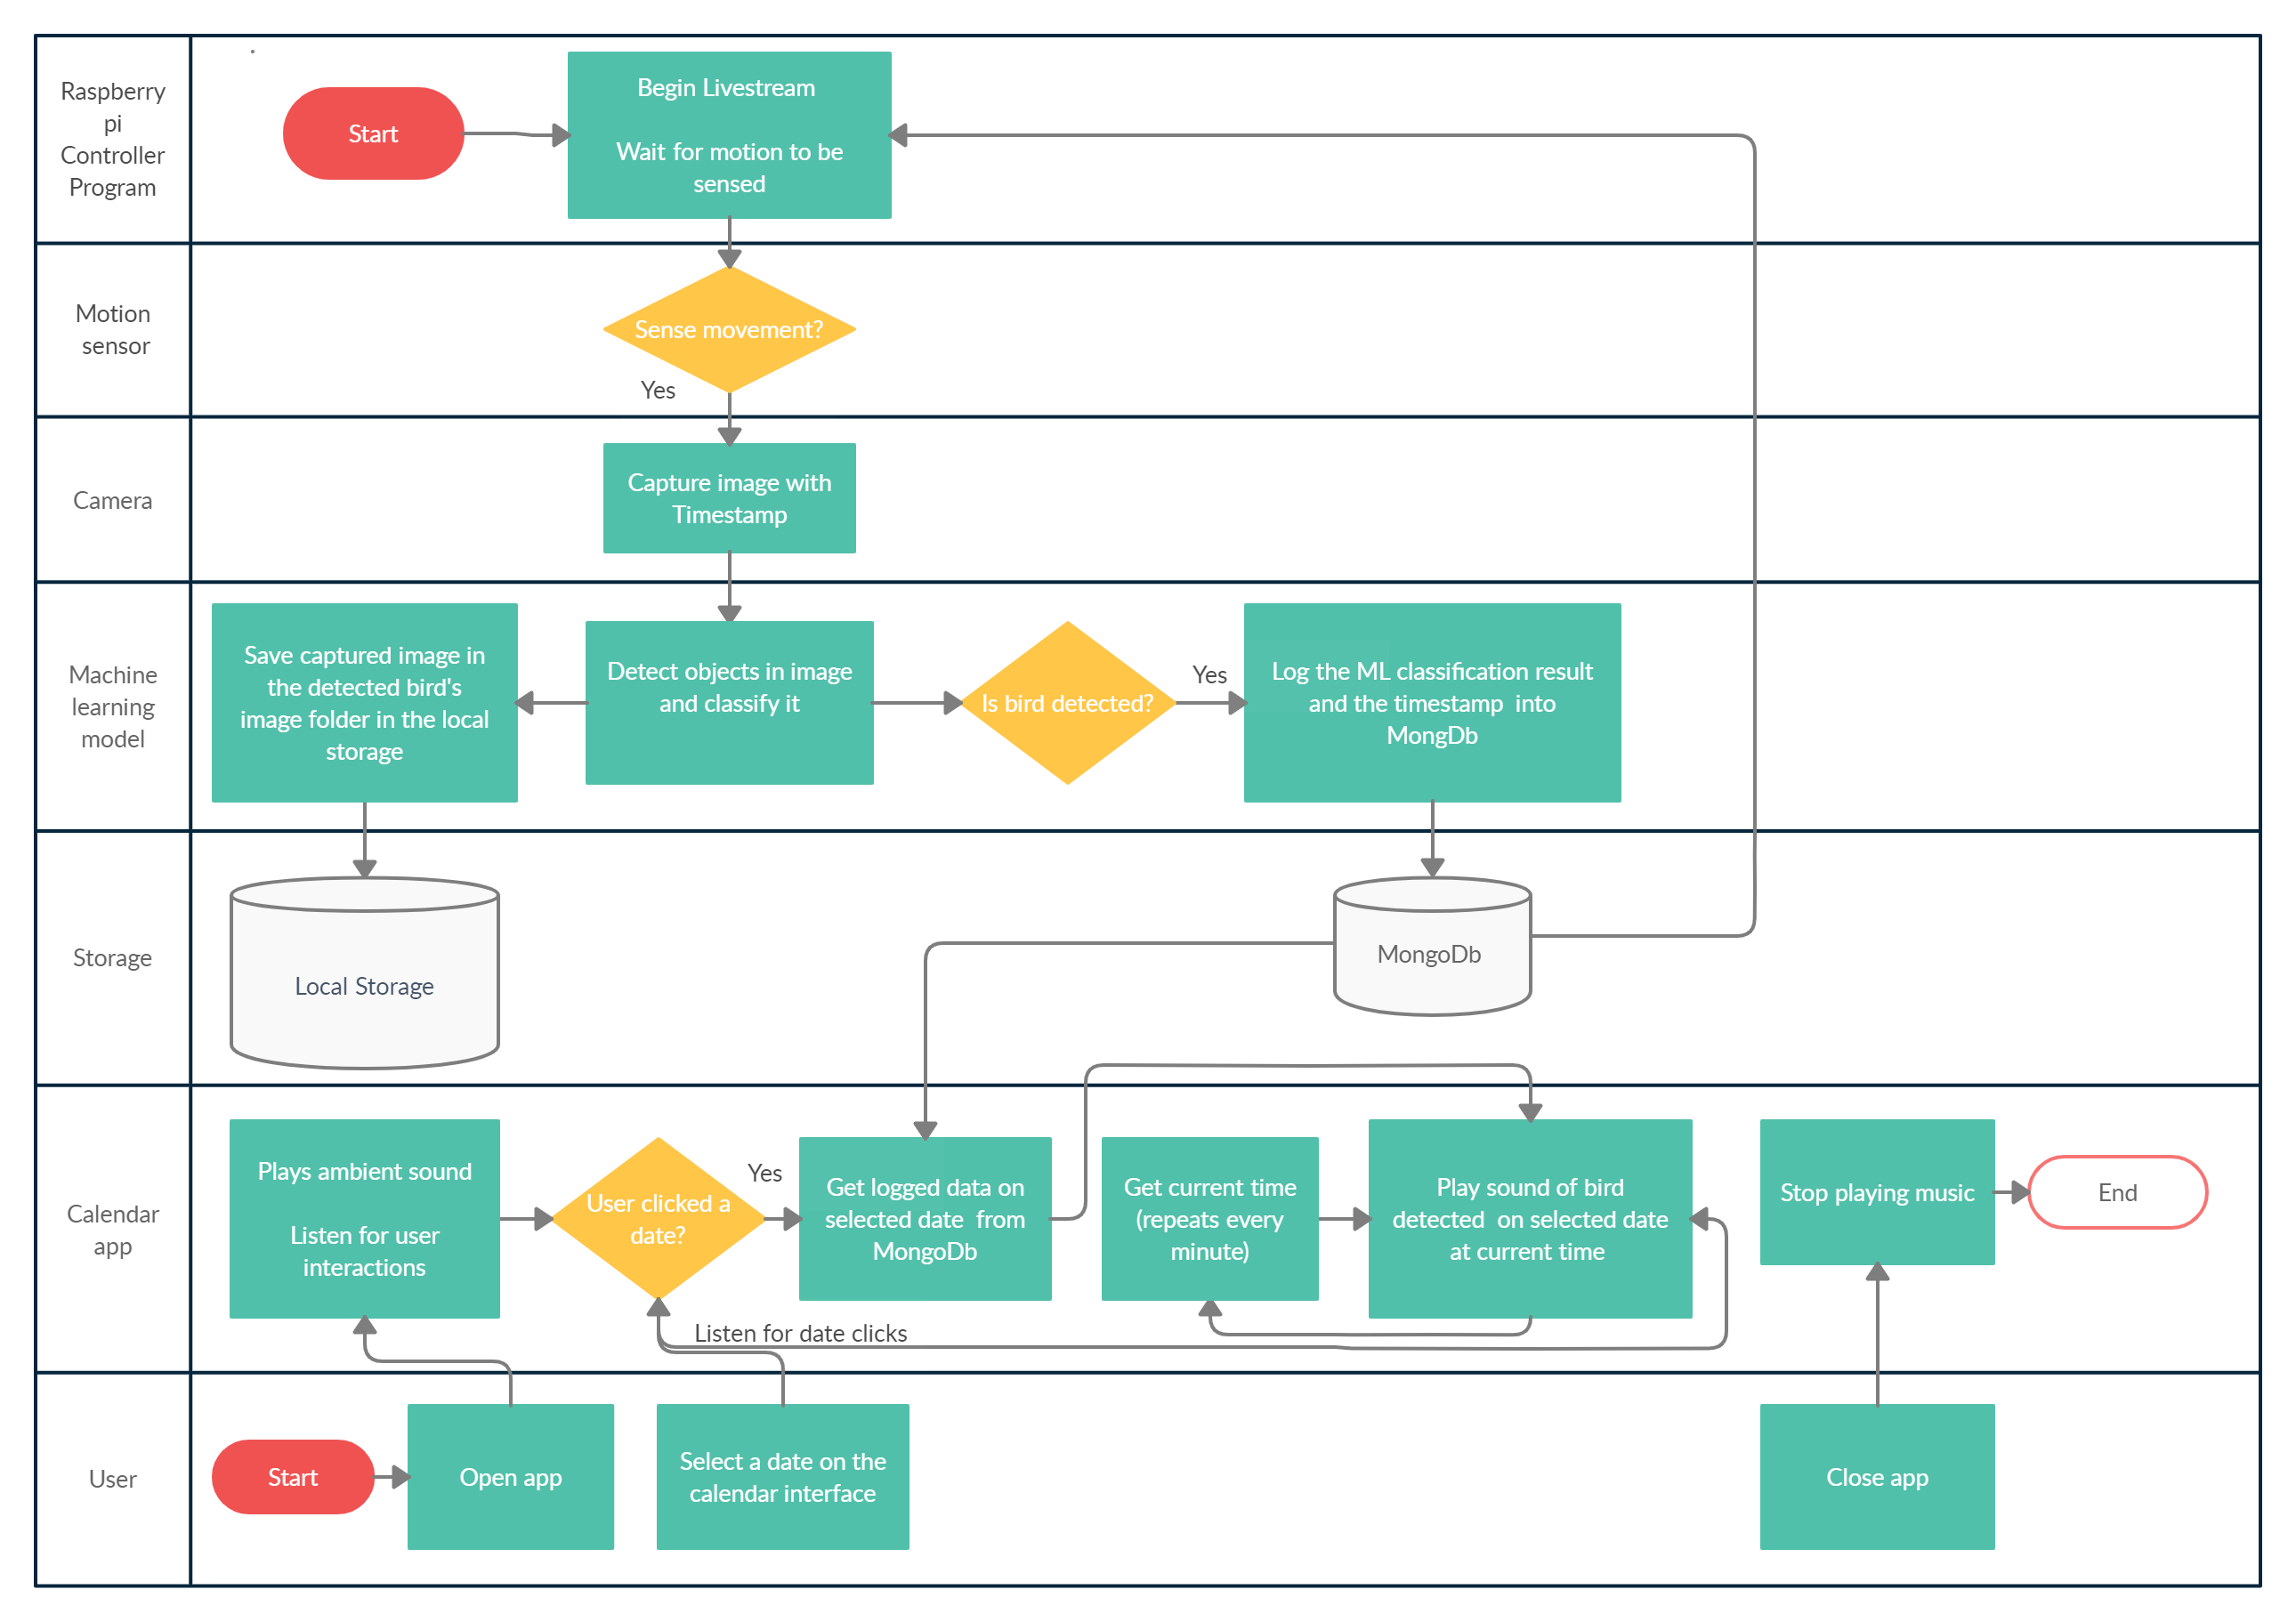
Prior to meeting with Ashita to analyze our systems, I created a system map in the form of a cross-functional flowchart on Creately as illustrated below to communicate how the Aviary works - the components and the process flows. The map creation process involved first determining the purpose of the map - for Ashita to comprehensively understand the system, what do I communicate to her through the system map?
A system consists of three kinds of things: elements, interconnections, and a function or purpose
Meadows (2008, p. 2). I decided to communicate the system's functions, components and the process flows; because they define the system and its behavior. If they are not communicated clearly, they and their emergent behaviors can't be understood nor anticipated.
Since I needed the system to be audited for safety and risks comprehensively, and recommendations will mainly be based on what I communicate to her, I wanted to tear apart the system so that she can "see" what the system is; to ensure her recommendations are suitable and relevant mechanisms for steering the system. I also had in mind the fact that she - the audience - already has enough systems background knowledge to understand the process map, and tried to ensure it wasn't too simple nor complicated.

A key influence in my decision to use a flowchart was my software engineering background. As an engineer, the most effective way of communicating control structure to my colleagues is via flowcharts because of its graphical and compact nature of capturing information, which aligns with the lessons I had learned from Chris on his public speaking calss that graphics can be effective in communicating abstract concepts to diverse audience. However, unlike software programs, the CPS is a multicomponent system (as shown in the map above) and the normal basic flowcharts for programs' algorithms I’m used to wasn’t able to capture the processes of the multiple components of the system and their roles. Hence, a cross-functional flowchart was more applicable to communicate the process flow of the Aviary. After creating the map, the next step was to meet and communicate our systems to each other.
Before I met with Ashita to present the system to her using the map, I had thought the map was clear, and comprehensive enough to graps what the system does to any audience, even in my absence. However, the meeting made me realize that I had left out relevant information like – who do I mean by the ‘user’? Is it the park rangers? Or the public? how does the raspberry pi get started? By who?
The exercise made me realize there are aspects of the system process I left uncommunicated probably because as the system expert, I subconsciously assumed they are obvious or didn’t think there were relevant to be communicated, and didn't realize these information were missing. This resulted in the map communicating the system incompletely to her - and I had to explain the missing parts to her.
There were other aspects of the process I couldn't communicate effectively just by describing them like - how the sounds get triggered on the interface and how the app work with the current time. I had to demo the process to her using the prototype application I had built beforehand. This made me also reflect on the importance of having prototypes when presenting software concept to external stakeholders. The prototype was really useful in making her “see” and experience the concepts (like the Human-computer interaction related processes) I was trying to communicate to her better aside the process of the system. Below is a screen grab of the system prototype I used for the demo.
Prior to this exercise, I had only communicated process flows to audiences (programers) using basic flowcharts, I had no experience using the cross-functional. Learning about cross-functional flowcharts and using it to explain the Aviary process flows helped me achieve one of my aims on CPSs explainability, which is - to learn how to explain cyberphysical systems (CPSs) work to diverse audience. I shall be using the cross-functional flowchart whenever I need to explain the process flow of CPSs and other multicomponent processes to a diverse set of people.
At the end of this activity, I learned that,- Graphics are effective in communicating abstract concepts to a diverse audience.
- Asides basic flowcharts, there are other types of handy process maps depending on what I need to communicate.
- Even though flowcharts communicate software process flows effectively, they are not appropriate for communicating CPS processes given their complex multicomponent nature.
- When communicating system interface desigh to audience, having a model (can be drawings, graphics, etc) or prototype of the interface is relevant.
Reviewing Powerpuggle as an Analyst
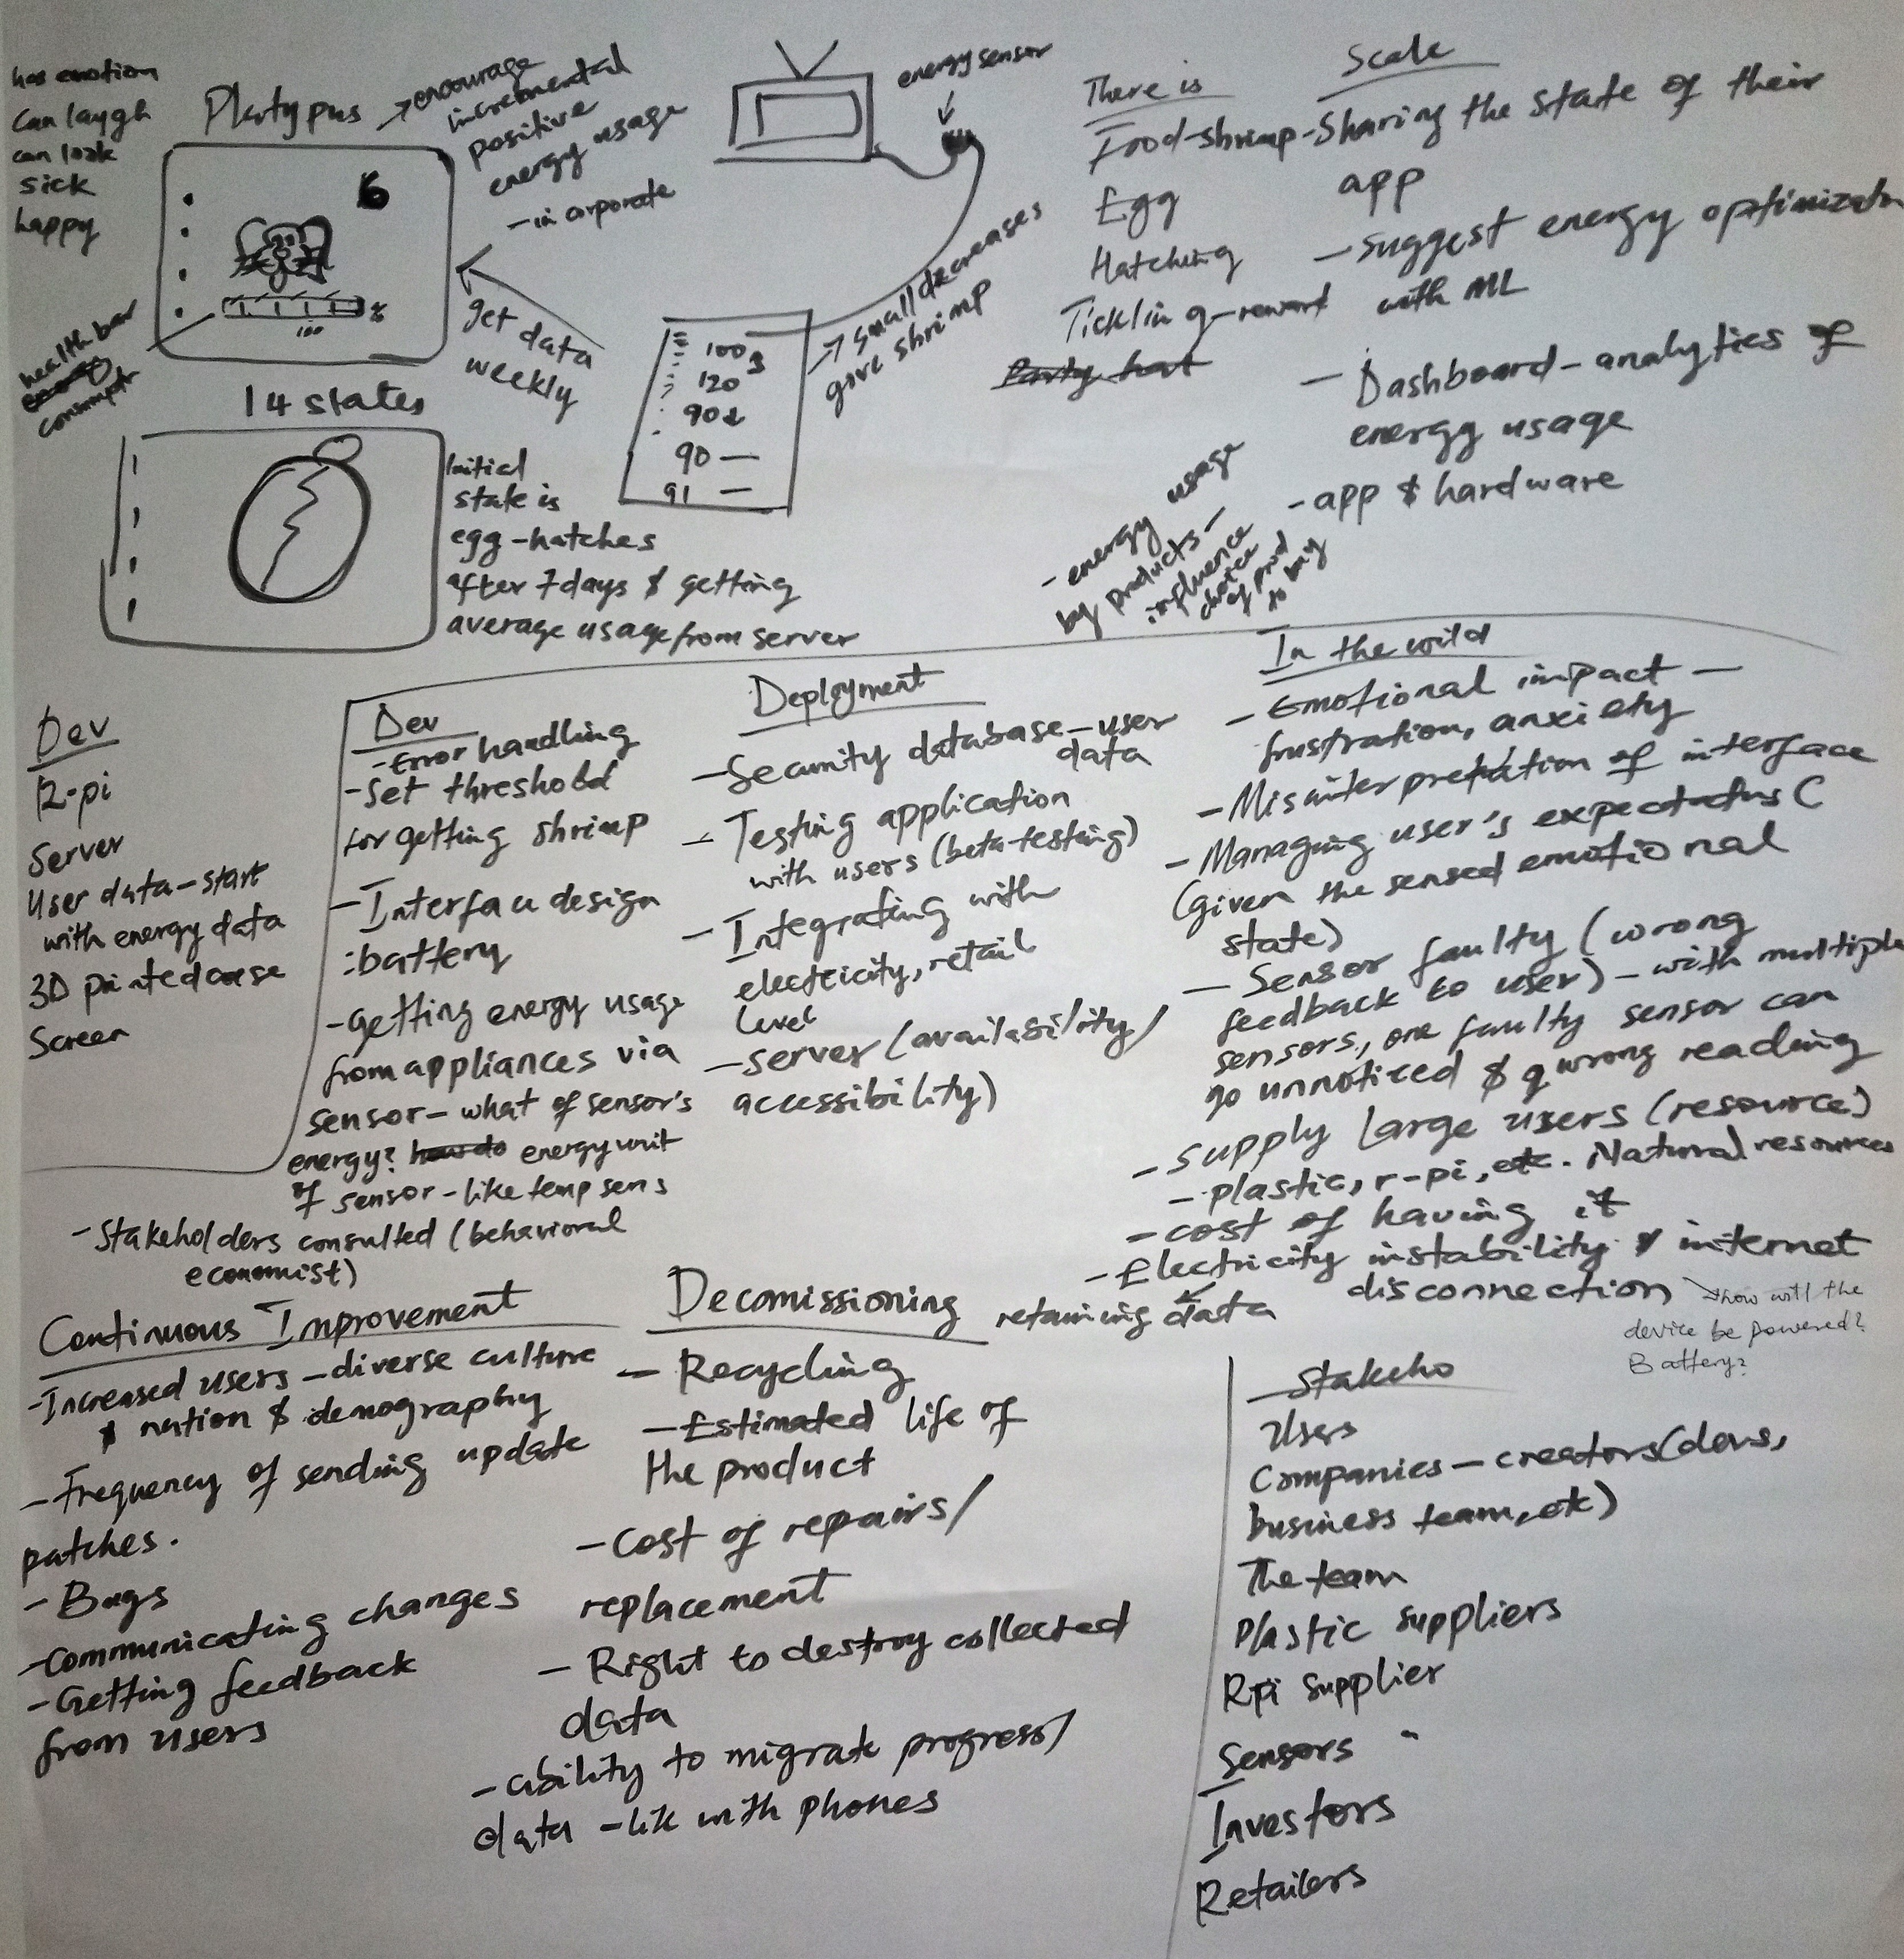
In this exercise, I switched roles with Ashita to review the Powerpuggle system - with Ashita as the system expert, and I, the system analyst. This exercise was aimed at understanding everything about the Powerpuggle system including the system's goal, components, stakeholders, interface design, control structure, and plans to scale. These are the information I needed for identifying oversight in the system and recommending steering mechanisms to the development team - Ashita. A snapshot of our discussions note is shown below.- intent - to help those who care about their energy consumption to monitor and reduce energy usage.
- potential users - people that care about energy consumption
- components - such as raspberry pi, energy sensor, database, cloud server, 3D printed case, screen, user data, etc.
- lifecycle - the process flow from design and development to installation in user's environment to monitoring and apprising them of their energy consumption
- Potential Users (can be companies)
- The software creators/company - including the development team and the business management team
- Investors (if any)
- Raspberry pi manufacturers and suppliers
- Plastic manufacturers and suppliers - for casing
- Energy sensor manufacturers and suppliers
- The system distributors and retailers

- Using machine learning (ML) to recommend ways users can optimize their energy consumption
- Using ML to analyze user's energy data and present the findings to users on a dashboard
- Users sharing their energy optimization progress with their friends and family on social networks
The Powerpuggle error audit maps can be found here and the governance map can be found here
Reflection
Prior to the exercise, as a software engineer, I only assessed software safety as a measure of its functionalities - does it meet its functional requirements? How does it respond to or recover from errors? Working on this exercise made me reflect on this prior pratice and I realized I have been assessing safety on just the software development phase - which is just a phase of the system lifecycle, and from a software engineer's standpoint. The exercise made me practice safety and sustainable system design from a cybernetic engineer perspective - zooming out the focus of the analysis beyond just the development phase and also exploring the system from different stakeholders' perspectives asides that of the engineer - like that of the users, investors, retailers, etc.
I learned the importance of futurism in sustainable system design - I needed to imagine a future for the system at scale in dffierent contexts to be able to recommend oversight againts that future. I also learned the relevance of role-playing when analyzing systems, it gave me the ability to take on the position of different stakeholders and experience the system from their perspectives. I learned that even though assumptions can be bad when communicating as an expert, it may be helpful to analysts in enivsioning the system at scale and identify potential risks in different potential states. Lastly, I learned that our experiences, backgrounds and subconscious biases will influence what we identify as risk, and how we prioritize them. This was evident when we were creating the error forms - most of the risks I idenfified were influenced on my experience as an engineer and Ashita was able to identify other risks I didn't consider. This also shows the importance of having a diverse team when designing and building scalable safe, responsible and sustainable systems. Encoding our assumptions and backgrounds in system analysis can be mamnged by being conscious of how they have influenced the analysis, and noting them in the analysis report.
I've been reading about participatory design but never had the opportunity to practice. This exercise reinforced the values of participatory design in me and I will continue to approach systems design and development using the participatory method - involving affected stakeholders come together to design and evalaute the system, especially for sustainablility in different dimensions.
References
- Meadows, D.H. 2008, Thinking in systems: A primer, Earthscan, London.
- Brand, S. 2008, The clock of the long now: Time and responsibility, Basic Books, New York.