Decision Tree from Scratch - Towards Explainable AI
Introduction
Machine learning (ML) models are key component of any AI driven system. Given that cyber-physical systems are powered by AI, hence ML, there is a necessity as a practitioner of Applied Cybernetics to understand what goes on in machine learning models. Which makes me to ponder on these questions - are ML models really black boxes? Can they go totally out of control? What are machine learning models? and what aspect of these model might be of interest of practitioner of the NBE when exploring CPSs?
In my attempt to understand machine learning models and answer these questions, I tried to build a decision tree model from scratch on the UCI zoo dataset. This was my way of tearing the model apart and "seeing" how it work and make predictions.
This page provides a documentation of my journey trying to "tear ML models apart" and then build it from scratch. I will be discussing my progress, challenges, decision process and my thoughts on my approach to understanding ML models. Is it effective to build ML models from scratch? Are there other efficient ways to understanding ML models?
The audience of this piece are the instructors of the Build course, hence the page does not go into the details about some basic ML and coding knowledge.
Achievement
At the end of the activities, I learned:- About different types of decision tree algorithms
- About decision tree algorithms and their decision metrics
- The steps involved in building ID3 decision tree classifier from scratch
- How to build and built the ID3 decision tree classifier from scratch
- How decision tree classifiers work
Prerequisite Knowledge and Learning resources
In preperation for the system analysis, I:- Read this introductory tutorial to decision trees, branches, split point, bias, variance, and measuring accuracy.
- Read this introductory tutorial model tuning and the bias-variance tradeoff.
- Learned about different types of decision trees like ID3, C4.5, CART, C5.0 here
- Read this tutorial by Hal Daumé III on how to build machine learning decision tree algorithms from scratch
Key Skills
- Python Programming
- Algorithmic problem solving
- Probability and Statistics
- Data Analytics
- Machine learning
- Decision tree algorithm
Activities
Data Analysis
In alignment with my biggest lesson from the Hal Daumé III resource that the biggest and most important task in building a decision tree is knowing the best questions to ask and their order. I attempted to manually determine the best questions to ask and their order when buiding a decision tree model for the UCI zoo dataset.
I began with getting the dataset and saving it as a zoo dataframe in this Colab Notebook, then explored the dataset for untidiness or dirtiness.
With the python codes -
zoo.head(), zoo.shape, zoo.info(), and zoo.describe(), I explored the data to check for:
- missing data
- incorrect variable types
- anomalies in the data distribution
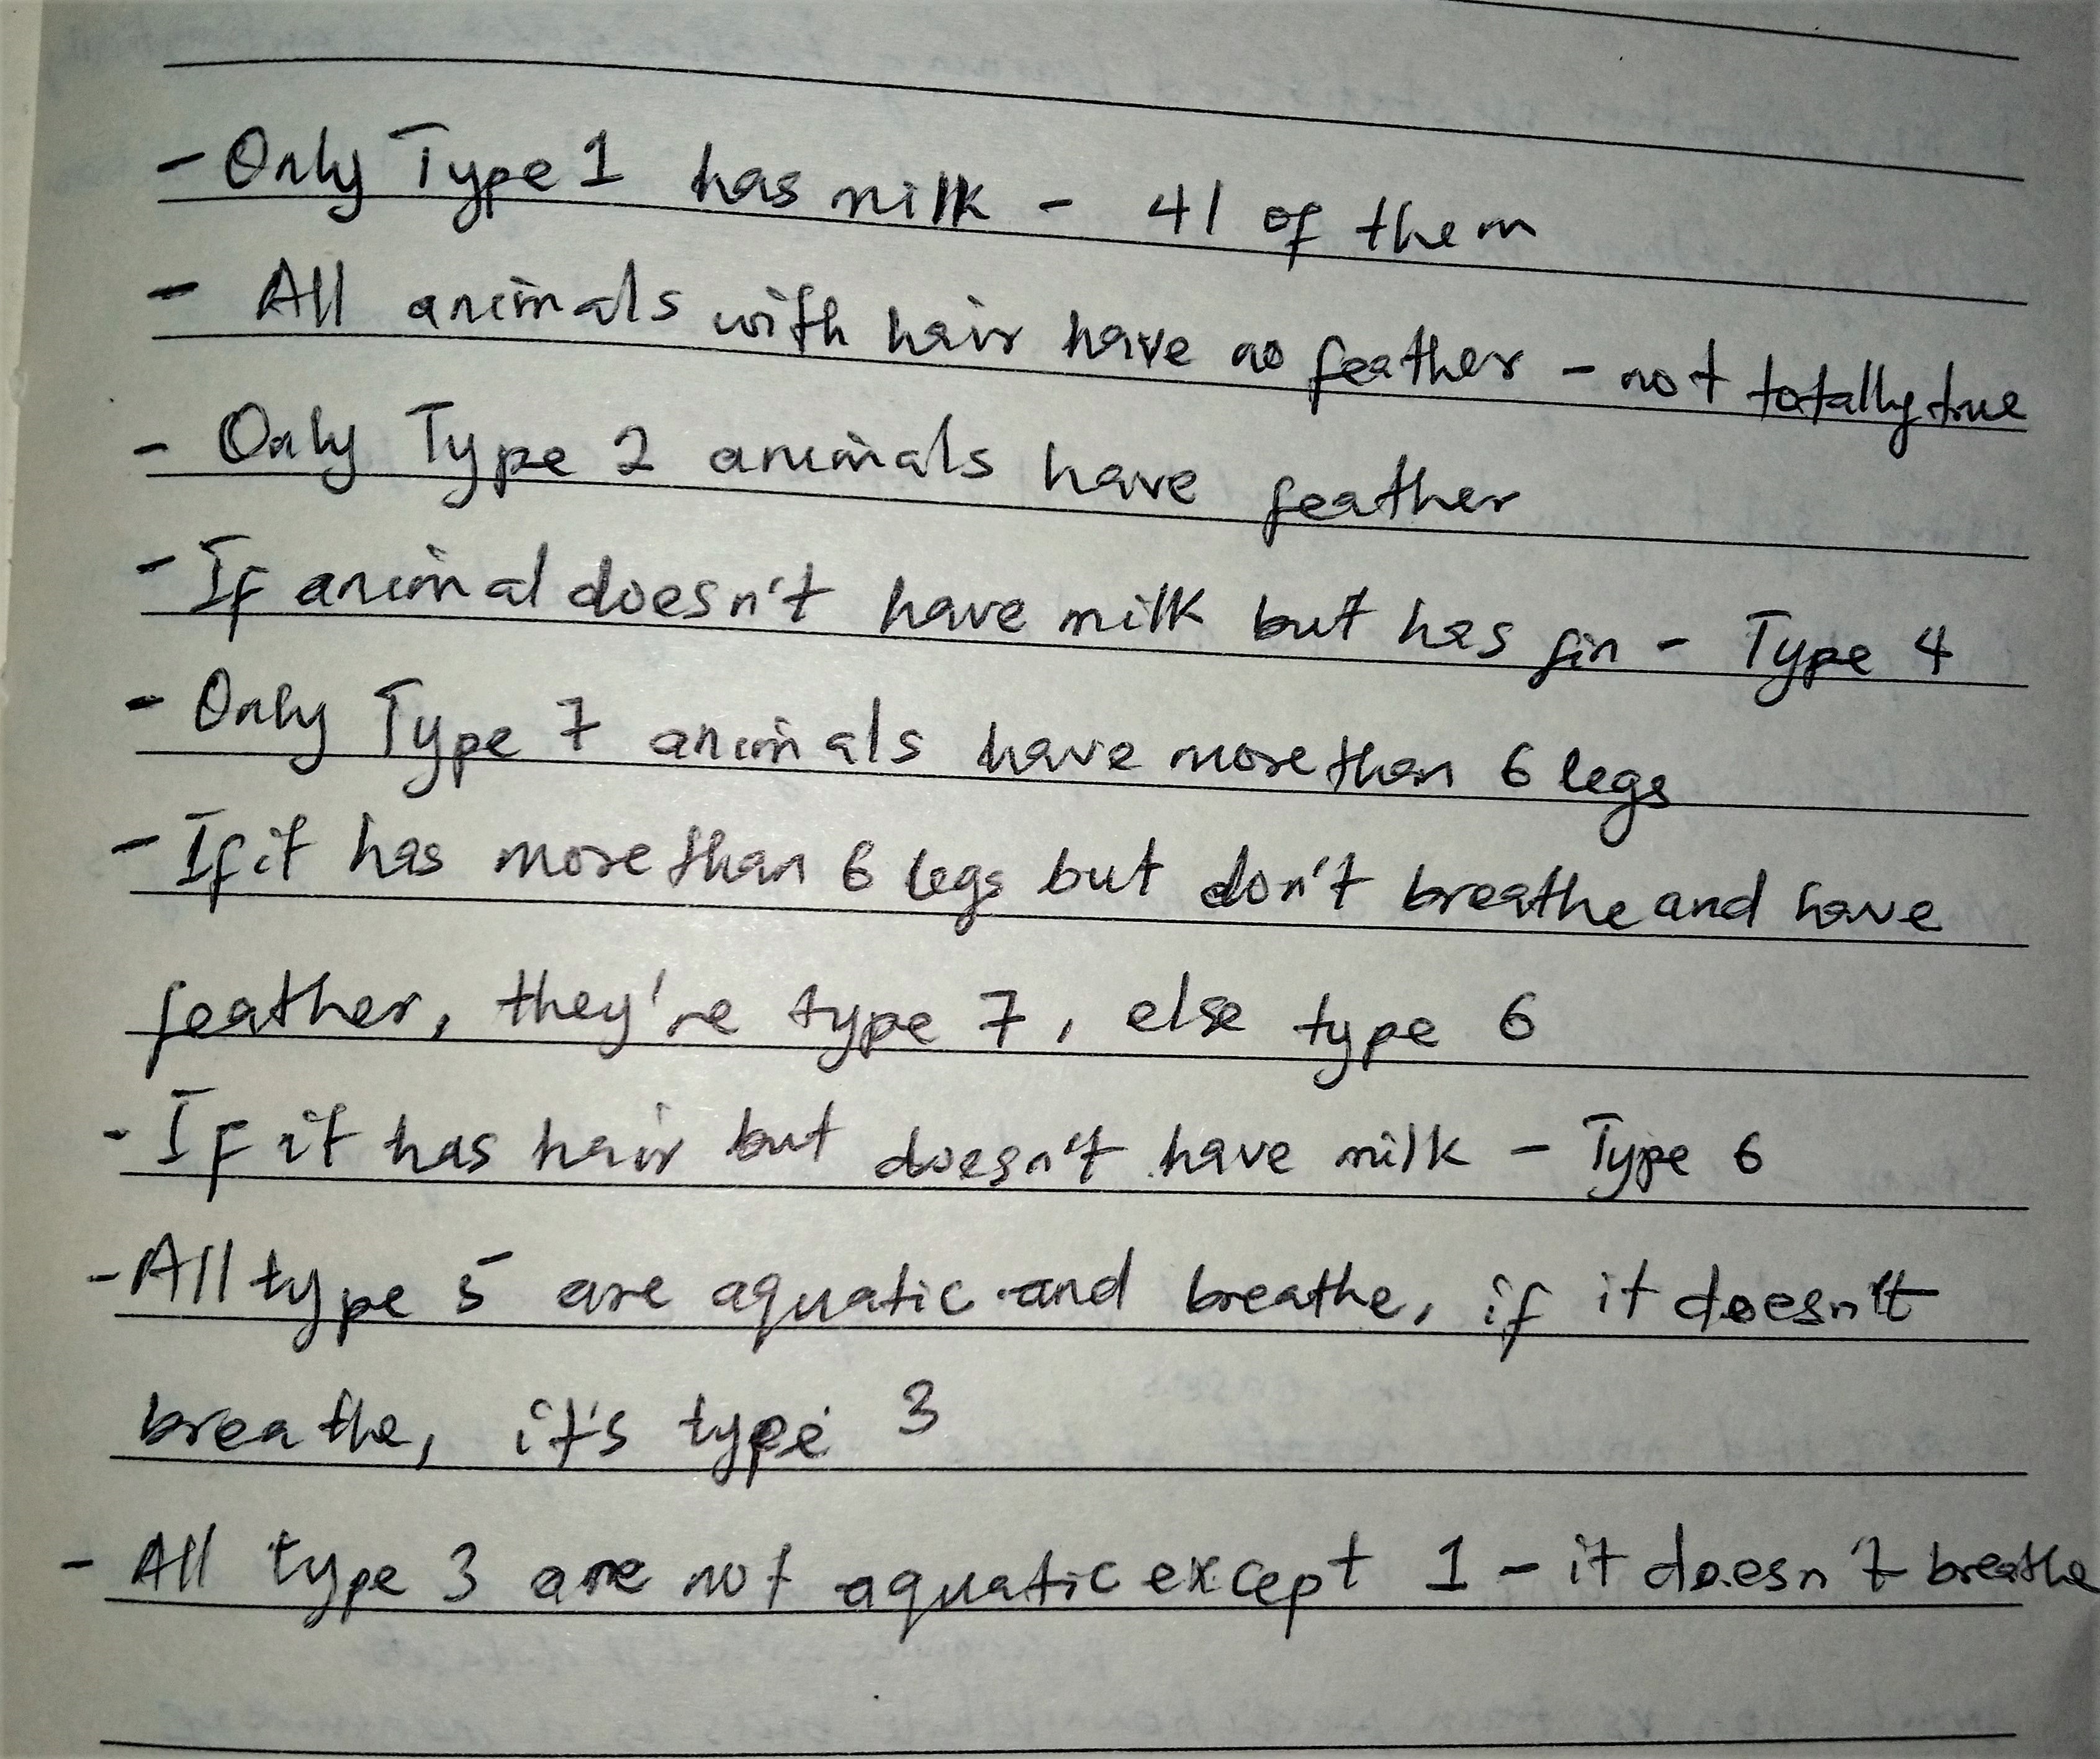
Afterwards, I explored each of the animal types or labels to determine what features or properties are peculiar to each animal type. For instance, I fetched entries of the zoo dataset where the animals are type 1. The query matched 41 entries and interestingly, all 41 of them produce milk, have backbone, breath, are not venomous, and have no feathers. Then, I further explored each of these feature associated with type 1 animals and found out that only type1 animals produce milk.
In essence, asking the question "does the animal produce milk" can determine if an animal in the dataset is type 1 or not. The code documentation of this process can be found in the Determining the Best Questions section of this Colab Notebook.
Learning About Decision Tree Algorithms
Before this step, I had read about decision tree algorithms and discovered the different types of decision tree algorithms mainly ID3, C4.5, CART, C5.0 as mentioned in the prerequisite knowledge section. In this activity, I implemented an ID3 decision tree alogrithm from scratch. I decided to build an ID3 algorithm because I learned from reading the scikitlearn decision trees documentation that the scikitlearn decision tree classifier is an implementation of the CART algorithm. I observed CART and ID3 are most popular among the algorithm types and I decided to implement the ID3 alogrithm so that I can compare the prediction results of both ID3 and CART.
The ID3 (Iterative Dichotomiser 3) algorithm is an algorithm that finds the independent variable that will give the highest information gain for the label or class (type variable in the Soo dataset) using a greedy approach. It does this recursively until the decision trees are grown to their maximum size.CART also uses this
highest information gainapproach except that it uses a different metric to determine the feature with the highest information gain. CART uses the gini index while ID3 uses Entropy. Entropy and Gini index are both measures of how impure the classification generated by splitting the dataset or subset using a given feature is. Also, entropy produces higher values while Gini index values are always less than 1.
Building ID3 Decision Tree
The code I wrote to implement the ID3 decision tree algorithm can be found in the ID3 Algorithm Implementation section of the Colab Notebook. The code was written as a python implementation of the ID3 pseudocode from wiki, and the formulas for Entropy and Information Gain. The formulas for entropy and information gain in shown in mathematical models as interpreted by me before implementation in the below images.


    def entropy(col):
    """
    Calculate the entropy of a dataset.
    It takes as parameter the column name.
    It returns the measures of impurity of the given column, the label column.
    The return type is double
    """

    #Get the counts of unique values in the column
    val_cnt = col.value_counts().sort_index()

    #Get the valuesin the column and their respective counts
    vals = val_cnt.index.tolist()
    counts = val_cnt.values.tolist()

    #Calculate column entropy
    entropy = 0
    for i in range(len(vals)):
        prob = counts[i]/np.sum(counts)
        ln = np.log2(prob)
        entropy = entropy - (prob * ln)
    return entropy
def Gain(data, var):
    """
    Calculates the information gain of a give dataset.
    It takes as parameters the dataset whose information gain will be claculated,
    and the variable on which the information gain will be calculated.

    It returns the information gain and the return types is double
    """
    #Calculate the entropy of the whole zoo dataset
    label = "type"
    data_entropy = entropy(data[label])

    ##Calculate the entropy of the dataset

    ##Get the values in the split variable and their respective counts
    val_cnt = data[var].value_counts().sort_index()
    vals = val_cnt.index.tolist()
    counts = val_cnt.values.tolist()

    #Calculate the entropy of the sub dataset
    sub_entropy = 0
    for i in range(len(vals)):
        sub_data = data.loc[zoo[var] == vals[i]]
        sub_label = sub_data[label]
        prob = counts[i]/np.sum(counts)
        sub_entropy = sub_entropy + (prob * entropy(sub_label))

    #Calculate the information gain on the variable
    Information_Gain = data_entropy - sub_entropy
    return Information_Gain
Challenges
Given my prior algorithmic problem solving and Python programming skills, the challenge with implementing the ID3 algorithm was mainly how to design the decision tree such that it will know the best questions to ask and ask them in the right order, determine when to cerate a branch, choose the best split point, etc. Trying to determine these questions manually through data analytics was not easy, however, building an algorithm that can do that recursively was almost an impossible task for me. The detailed instructions from the ID3 wiki page helped me get started with implementing some of the functions needed like the entropy and information gain, before implementating the ID3 algorithm itself. On the flip side, it made me conscious of the actions and decisions I took when I did it manually that I didn't take note of - how did I know what questions to ask as I examined each variable related to a type recursively? how did I know when to stop?
Afterwards, the next challenge was testing the model by fitting it to the dataset and making predictions on unlabeled data entries - only then can I compare its result with scikit-learn's. I was so excited about implementating the algorithm that I didn't realize I needed the “predict” or "fit" function to be able to test the model on data. I actually didn't know I needed to program the function too until then. To solve this, I spent hours searching for pseudocodes to implement decision tree classifiers "fit" or "predict" function online but couldn’t find it.
Since I couldn't find any resource that could help me with understanding and implementing the "fit" and "predict" functions from scratch, I used the code snippets for the Predict function by Bernd Klein from here.
Even though I couldn’t implement the predict function on my own from scratch, being able to implement the ID3 algorithm myself is a huge step for me towards explainable CPSs and AI. It is my first baby step towards unraveling ML algorithms and figuring out how to make it more explainable to diverse audience.
Prior to this exercise, even though I have background statistic and probability knowledge, I had assumed a lot of things about how decision tree classifiers work as mentioned earlier; and this exercise has been really eye-opening and proved my assumptions wrong. I can proudly say I was able to implement a machine learning decision tree classifier from scratch. I am excited to get better at this and explore how to demystify CPSs and AI driven system to the public.
Takeaway Lessons and Future Plans
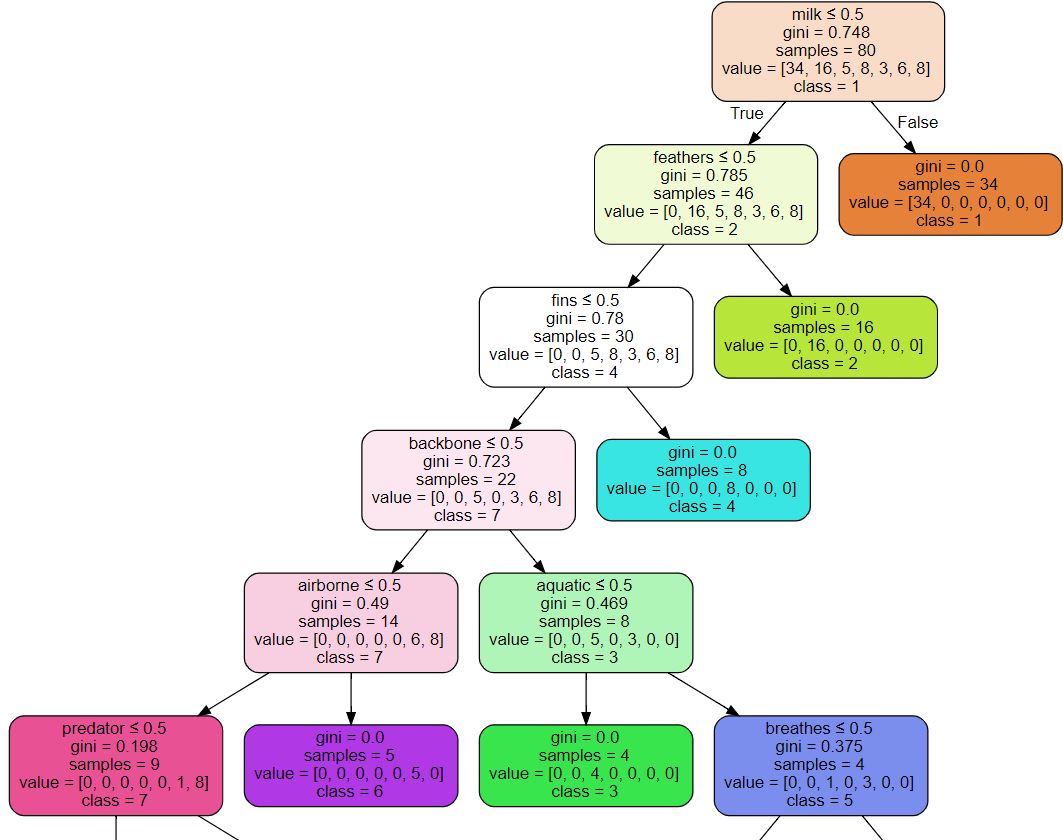
The main lesson from this exercise is that machine learning algorithms are not really black-boxes, they are implementations of existing probabilistic and statistical rules and can be made explainable if conscious efforts are put into designing them in such a way that their algorithms "at the backend" are more accessible to those interested in it. It can also be more explainable by illustrating how the predictions are gotten like with the scikit-learn decision tree visualization. I see this graphical approach to explainability being handy when building explainable
CPSs; and I intend to keep these in mind when designing ML models driven CPSs in the future.
Additionally, when I was trying to understand the formulas for entropy and information gain, I found having mathematical models that document and validate my understanding of the model was really useful. As a computer scientist, I used mathematical models alot to communicate logics but as I had spent the last few years as a software engineer in industry, I had increasingly forgotten how useful and handy they can be. This activity reminded me that modeling is important and it can be mathematical. As I build complex models for CPSs in the future, I see mathematical models as a tool that will be useful to me in documenting logics or processes and communicating them to practitioners.
Given my experience with implementating the ID3 model from scratch, I think it is more efficient to use existing pre-trained models that can carry out an intended ML when working on projects because it saves time and pre-trained models are usually trained with huge data which might be difficult to collate from scratch. This need to be preceeded with critical analysis of the models and the training dataset to check for biases and other sources of problems in ML models. If the existing model is not good enough, it can be tweaked to fit our needs via transfer learning and fine-tuning. Building the model from scratch should be the last option and should only be considered when the risk of the model at scale is high and transfer learning or other approaches to improve pre-trained models to fit our needs cannot eliminate all the anticipated high risks.
A fun Project - Building Custom Image Classifier from Scratch
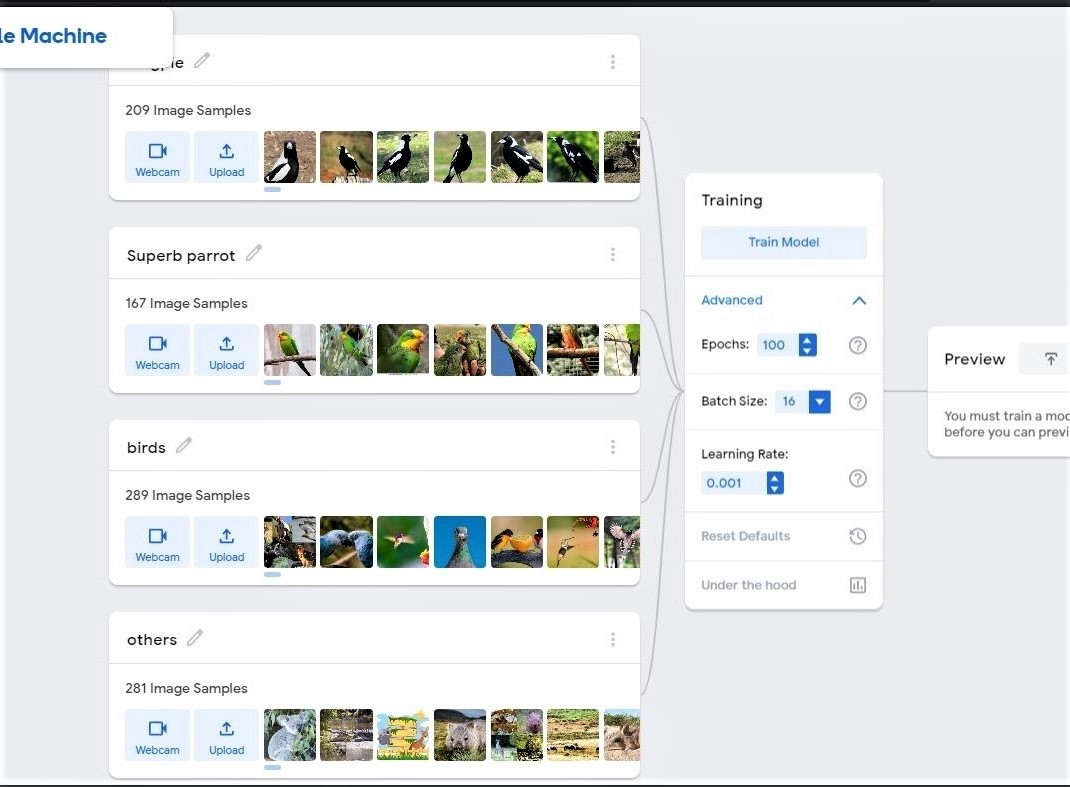
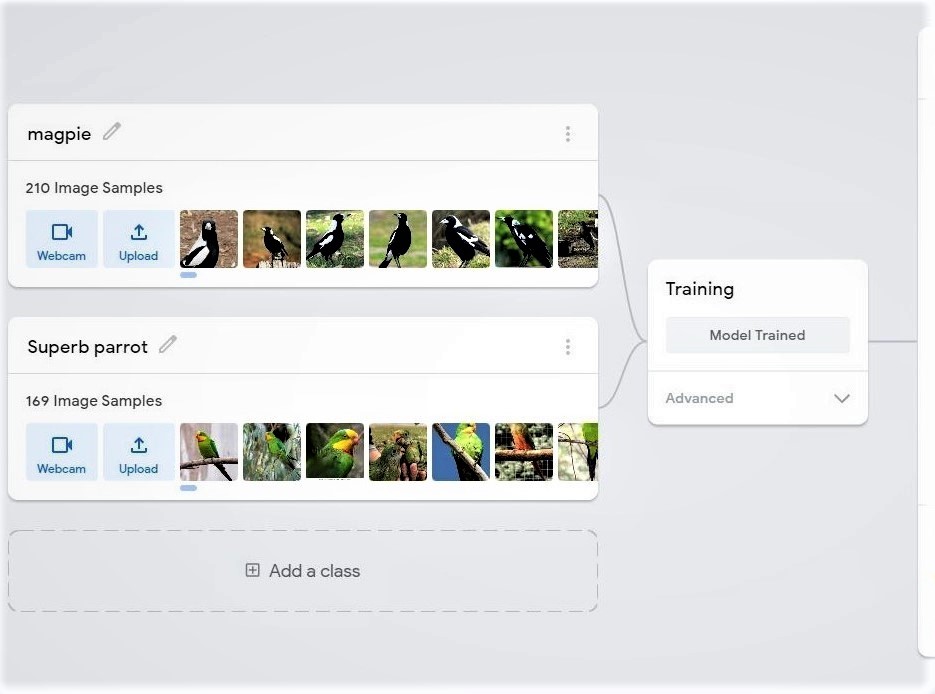
I tried to build a custom image classifier from scratch with Teachable machine for the Aviary CPS; to also achieve my learning goal of being able to build ML algorithms from scratch. On the first iteration, where I trained the model with only images of the object classes I was interested in, the model was overfitted and couldn't correctly classify other object types. The model classified given objects as belonging to a class it has the closest similarity to even if it is a wrong class. I learned that I needed more data for higher accuracy and if I am interested in just say "x" classes, I need atleast "x+1" object classes for the model to be robust.
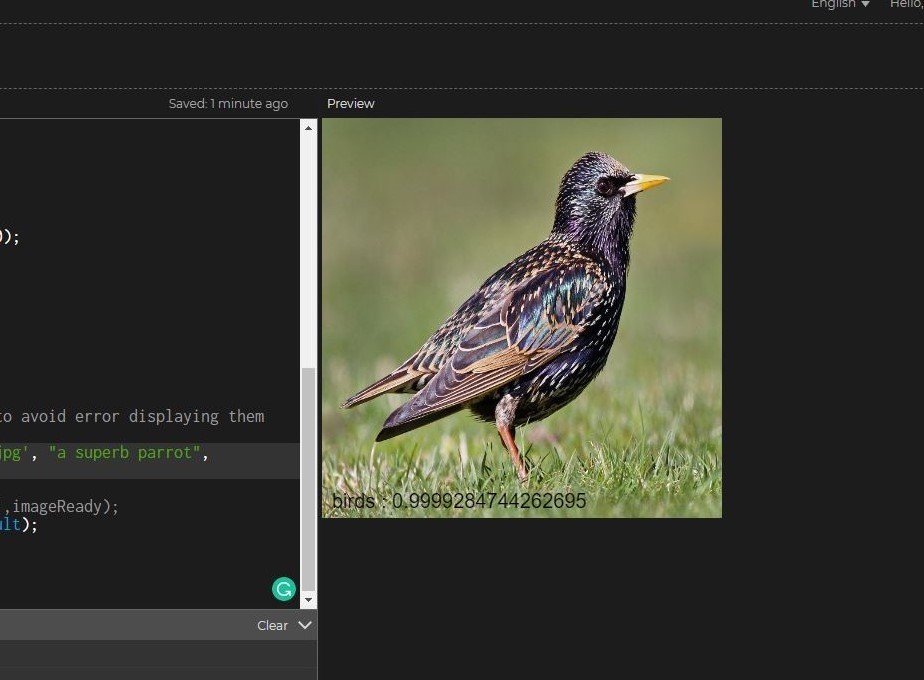
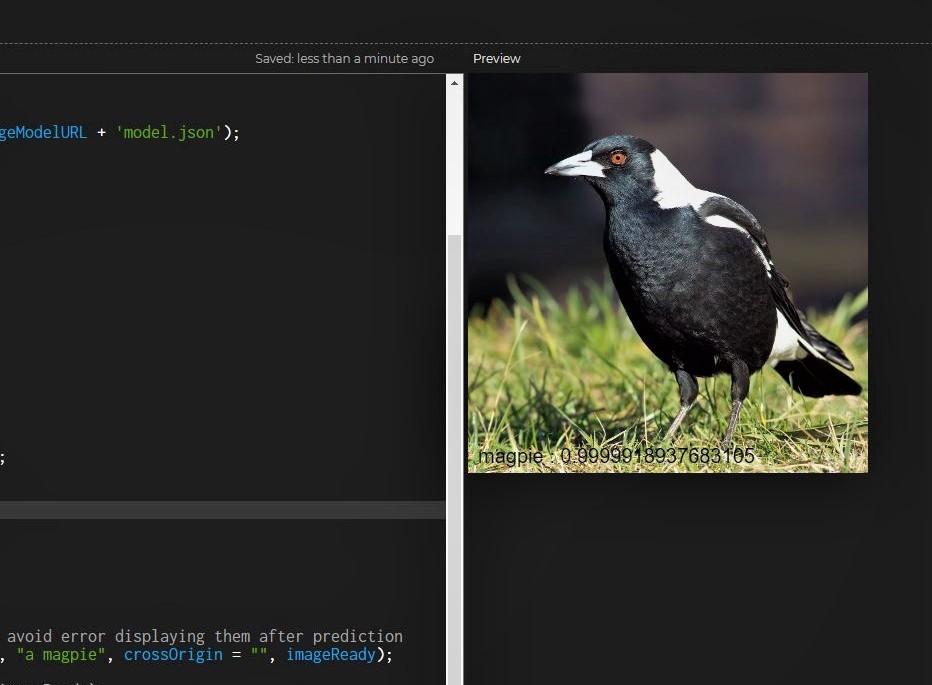
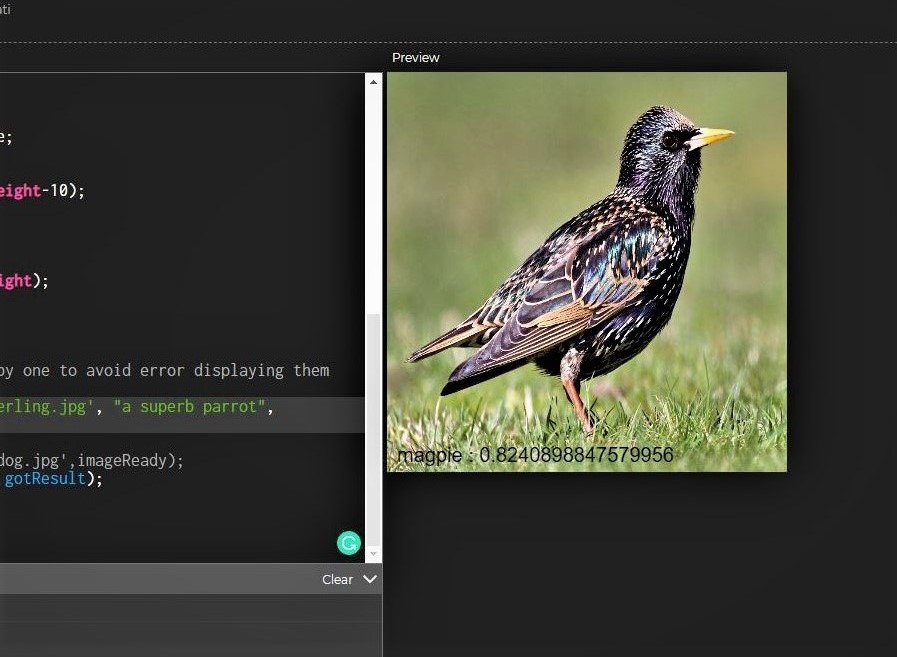
As shown in the images below, I tried to build a bird image classifier that can identify Magpies and superb parrots, so I created a model with just those 2 classes. Afterwards, I created a P5.js application to serve as testing ground for the model. When I tested it on Magpie images, it correctly identified them. However, when I tested it on other images like Sterling, it misclassified them as Magpies.
On the next iteration, I trained the classifier with more classes than I was interested in and used approximately the same amount of images for each classes and as can be observed in the below images, the model doesn't only correctly classify Magpies, it also correctly classifies Sterlings as Birds too.
