System Analysis
Introduction
As practitioner in the New Branch of Engineering (NBE) - Applied Cybernetics who will constantly be questioning, building and investigating systems, the importance of system analysis cannot be overemphasized. In system analysis, we get to frame research questions about systems, model systems behavior and experiment on systems amongst others.
This page provides a description of my experience conducting evidence-based system analysis on my fridge; the experiment was conducted to explore the fridge behavior relative to the number of items placed in it at a time. In other words, to explore the effect the number of items added in the fridge has on the fridge cooling time. A documentation of the process from framing a research question to analyzing the experiment results is provided here. A detailed reflection on the challenges, decision process, skills and lessons learned, and achievement is also covered in this piece.
Achievement
At the end of the activities, I learned how to:- Frame scientific research questions.
- Create dynamic system models using causal loop diagrams
- Perform experiments to explore research questions
- Document and present results of scientific researches in system analysis reports
Prerequisite Knowledge and Learning resources
In preperation for the system analysis, I:- Refreshed my knowledge on the concept of Systems thinking and causal loop reading chapter 1 of 'The Basics in Thinking in System: A Primer' by Donella H. Meadows.
- Learned how to construct influence and causal loop diagrams in details by reading Proust K, and Newell B.'s 'Constructing Influence Diagrams & Causal Loop Diagrams'
- Learned the concept of stock and flow diagrams in details reading Aronson, D. & Angelakis, D's 'Step-by-step stocks and flows: Improving the rigor of your thinking.' here
- Learned how to convert causal loop diagram (CLD) to stock and flow diagrams reading Aronson, D. & Angelakis, D's 'Step-by-step stocks and flows: Converting from causal loop diagrams.' The Systems Thinkier.here
- Learned how to use LOOPY and Insight Maker to model dynamic system behaviors
Key Skills and Components
- System analysis
- Python programming
- Tableau Desktop: to analyze the logged data
- LOOPY: to model the system's behavior in CLD
- Insight Maker: to model the system's behavior using stock and flow diagram
Components
- LG GR-A207CTBA refrigerator – set to -230C freezer control: the system to be analyzed
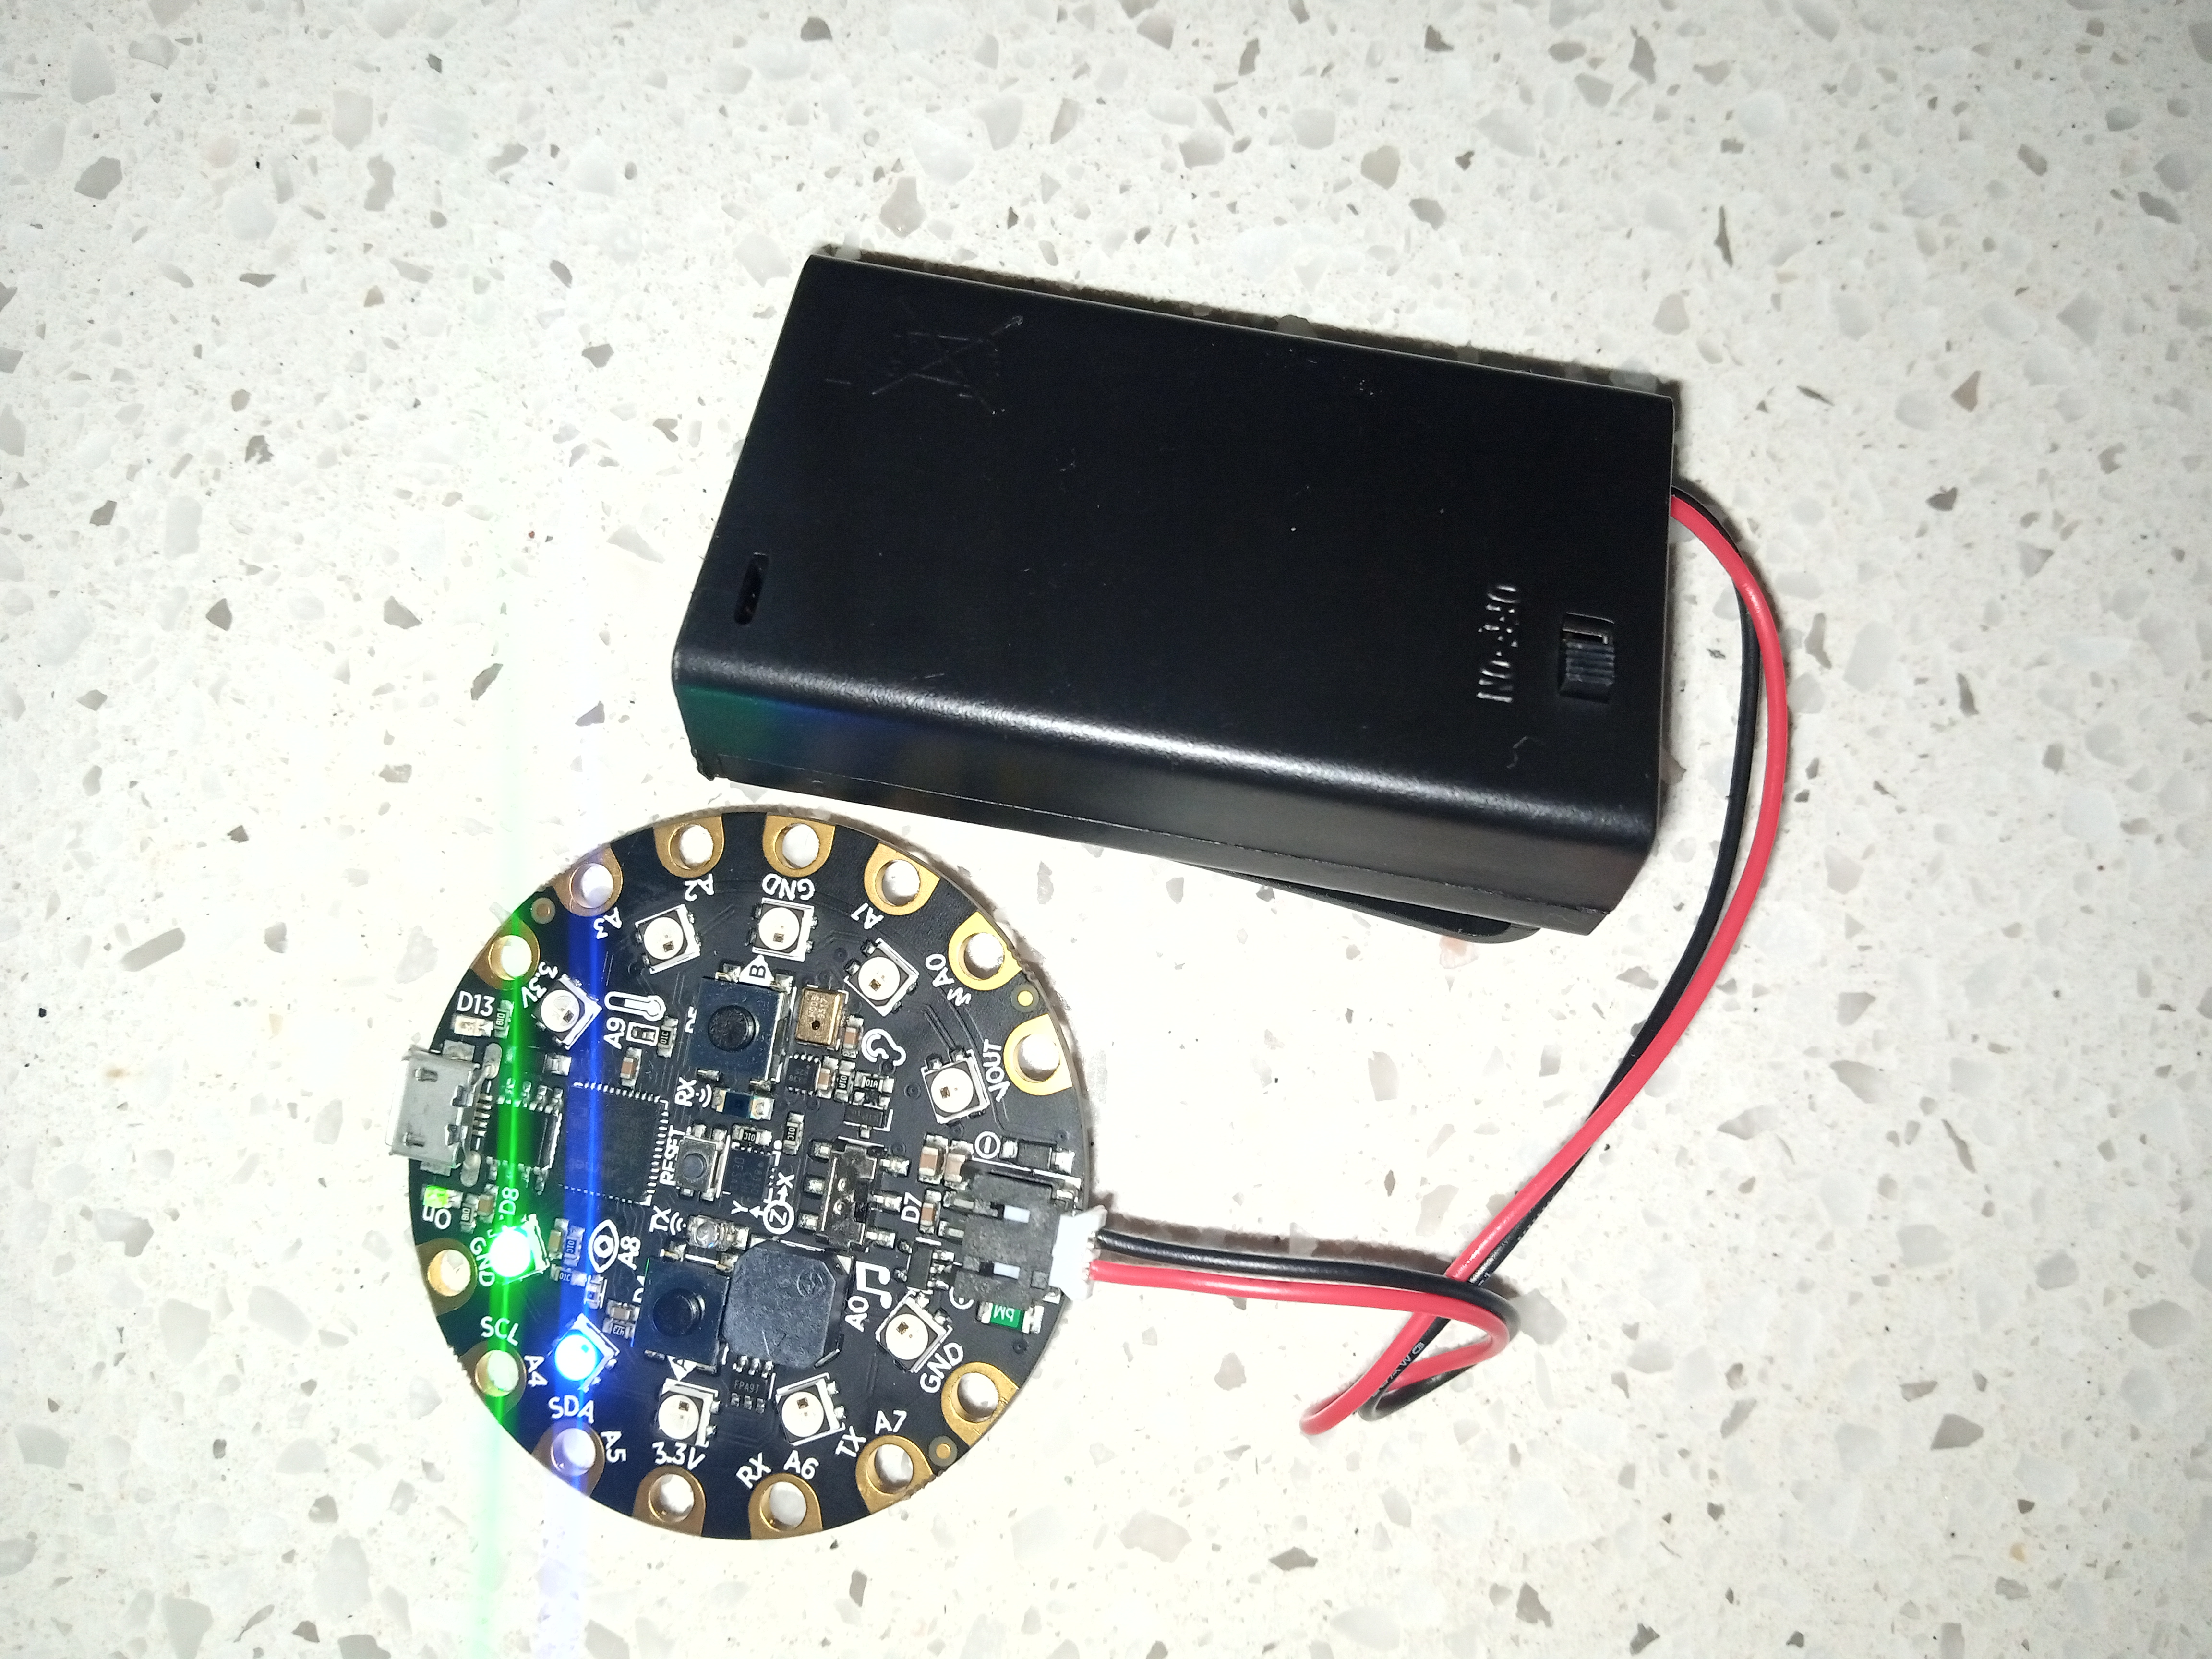
- Circuit playground express (CPE) onboard thermistor: for sensing the Fridge temperature
- A 3 x AAA Battery Holder with On/Off Switch and 2-Pin JST: to supply power to the CPE
- 3 PKCell 1.5V Ultra alkaline batteries
- A USB Cable: to connect the CPE to my laptop
- Laptop
- Stop watch: to track the experiment time
- Note: to document the system's state at a time
- Food items: placed incrementally in the fridge
- Python code: to log the Fridge temperature in a csv file
Activities
Framing Research Question
In system analysis, having a research question helps to formally define the purpose of the analysis and serves as a guide to the researcher throughout the analysis process. I preceeded the analysis with crafting a research question about the fridge behavior. To do that, I had to first figure out what aspect of the fridge am I interested in? What is the analysis boundary? Does I treat the Fridge as a subsystem or as a system of systems? What's the research intent and purpose? Having a research question does not only answer these questions but also guide the research.
I was interested in how Fridges react internally to the addition of new items into it. I could have asked the question - "Does the number of items in the Fridge affects its behaviors?" However, that wouldn't make a good research question as research questions have to be clear, focused, obvious, not a yes or not question and researchable with the tools and time I have. Having considered these key questions, I framed the research question as How does the number of items placed in the fridge affect the time it takes the fridge to return to its base temperature
Modeling the Assumed Fridge Behavior
Even though we (researchers) like to believe we approach researches from an objective standpoint, we mostly have an assumption of the system behavior before the research. How do we document and communicate our assumption, and ensure it doesn't influence us nor the research? In systems thinking, systems map can be created to capture dynamic system's behavior; this can be done with causal loop diagrams, stock and flow diagrams, etc. Systems maps are not only handy in communication our assumptions, they can also be used in illustrating and communicating the research finding to broad audiene.
Having defined my research question, I created a system map to capture areas of the system that I assume are of interest to the analysis, and to communicate my assumptions of how the system works and validate it prior to the experiment. I created a CLD communicating my assumption of the Fridge behavior relative to the items in it as depicted below. The CLD can be found here
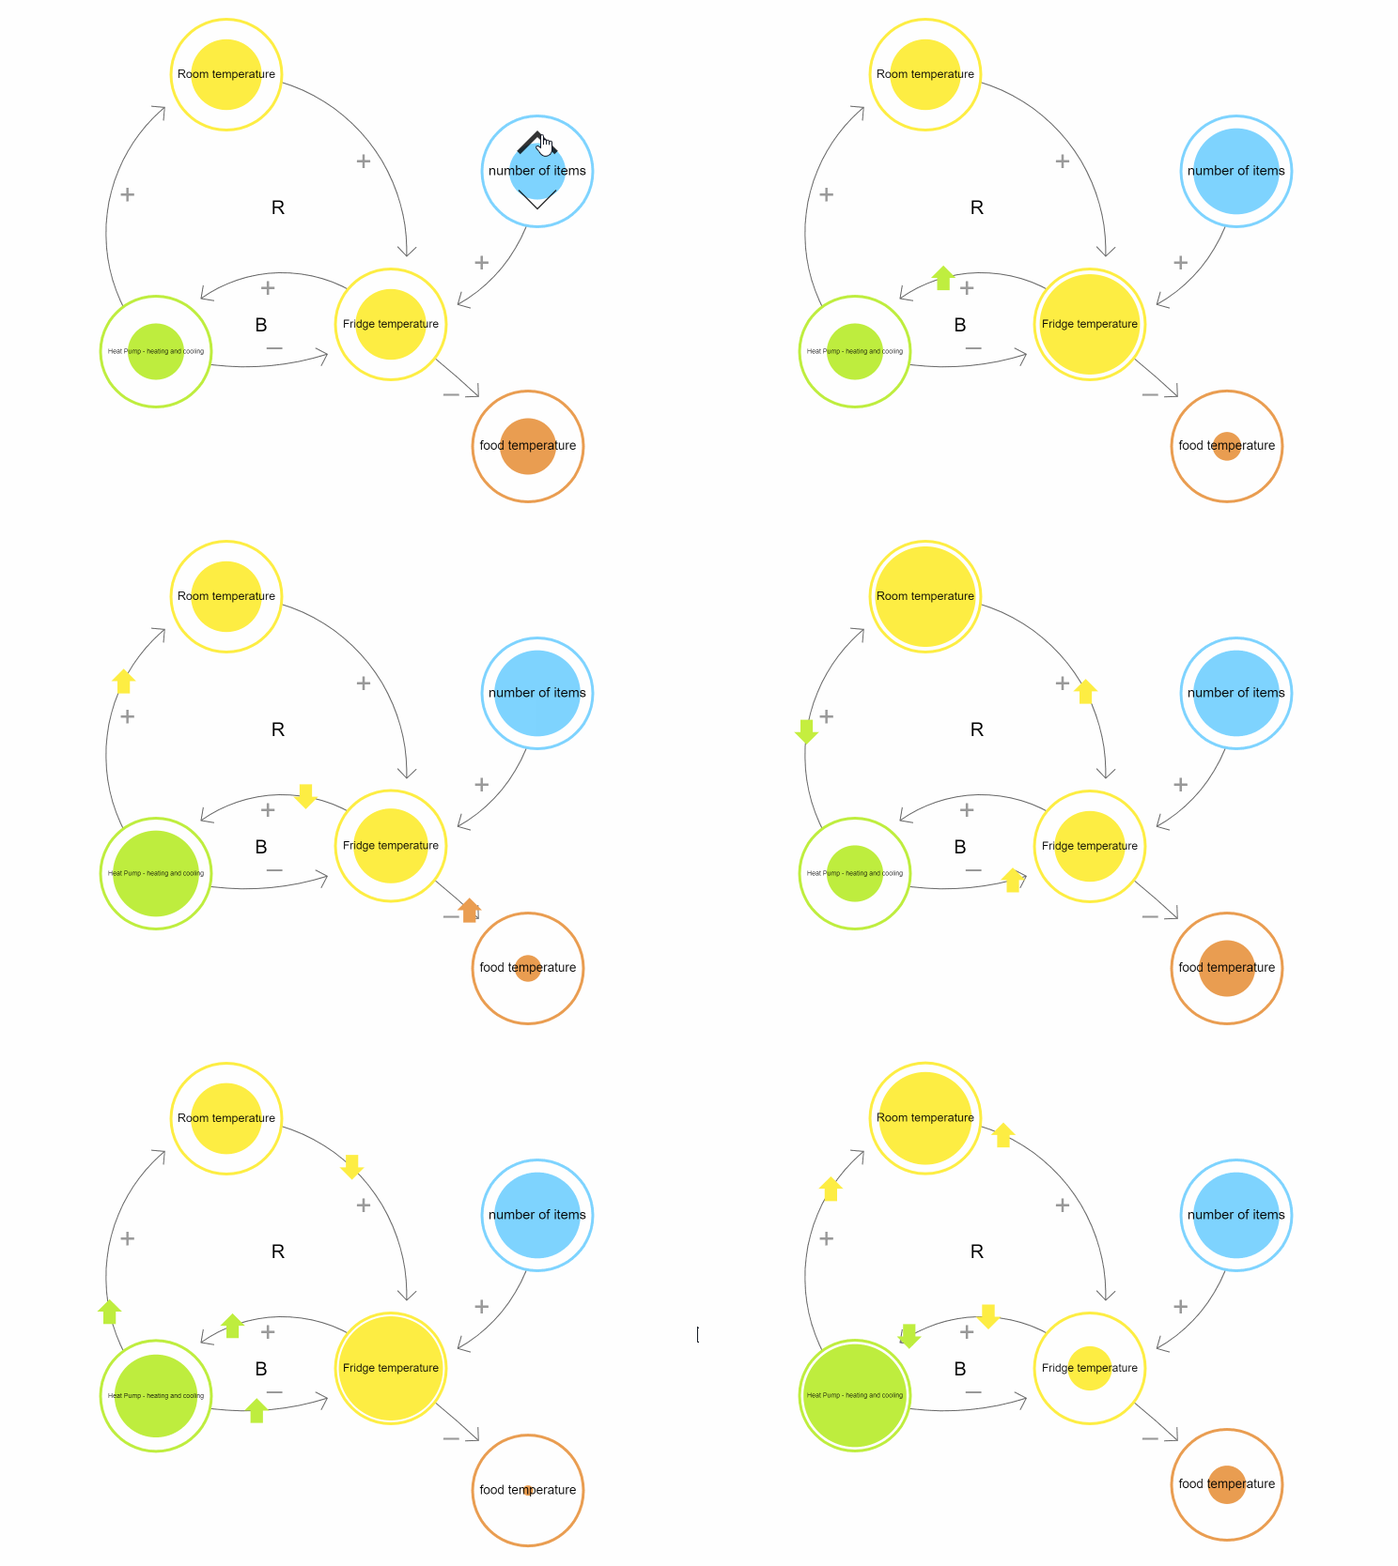
All models are wrong, but some are useful. Even though I think this map is useful for my analysis, there are other context where it will be useless, making it important to make explicit our assumptions as we create system models and their limitations or area of relevance.
Experimenting on the Fridge
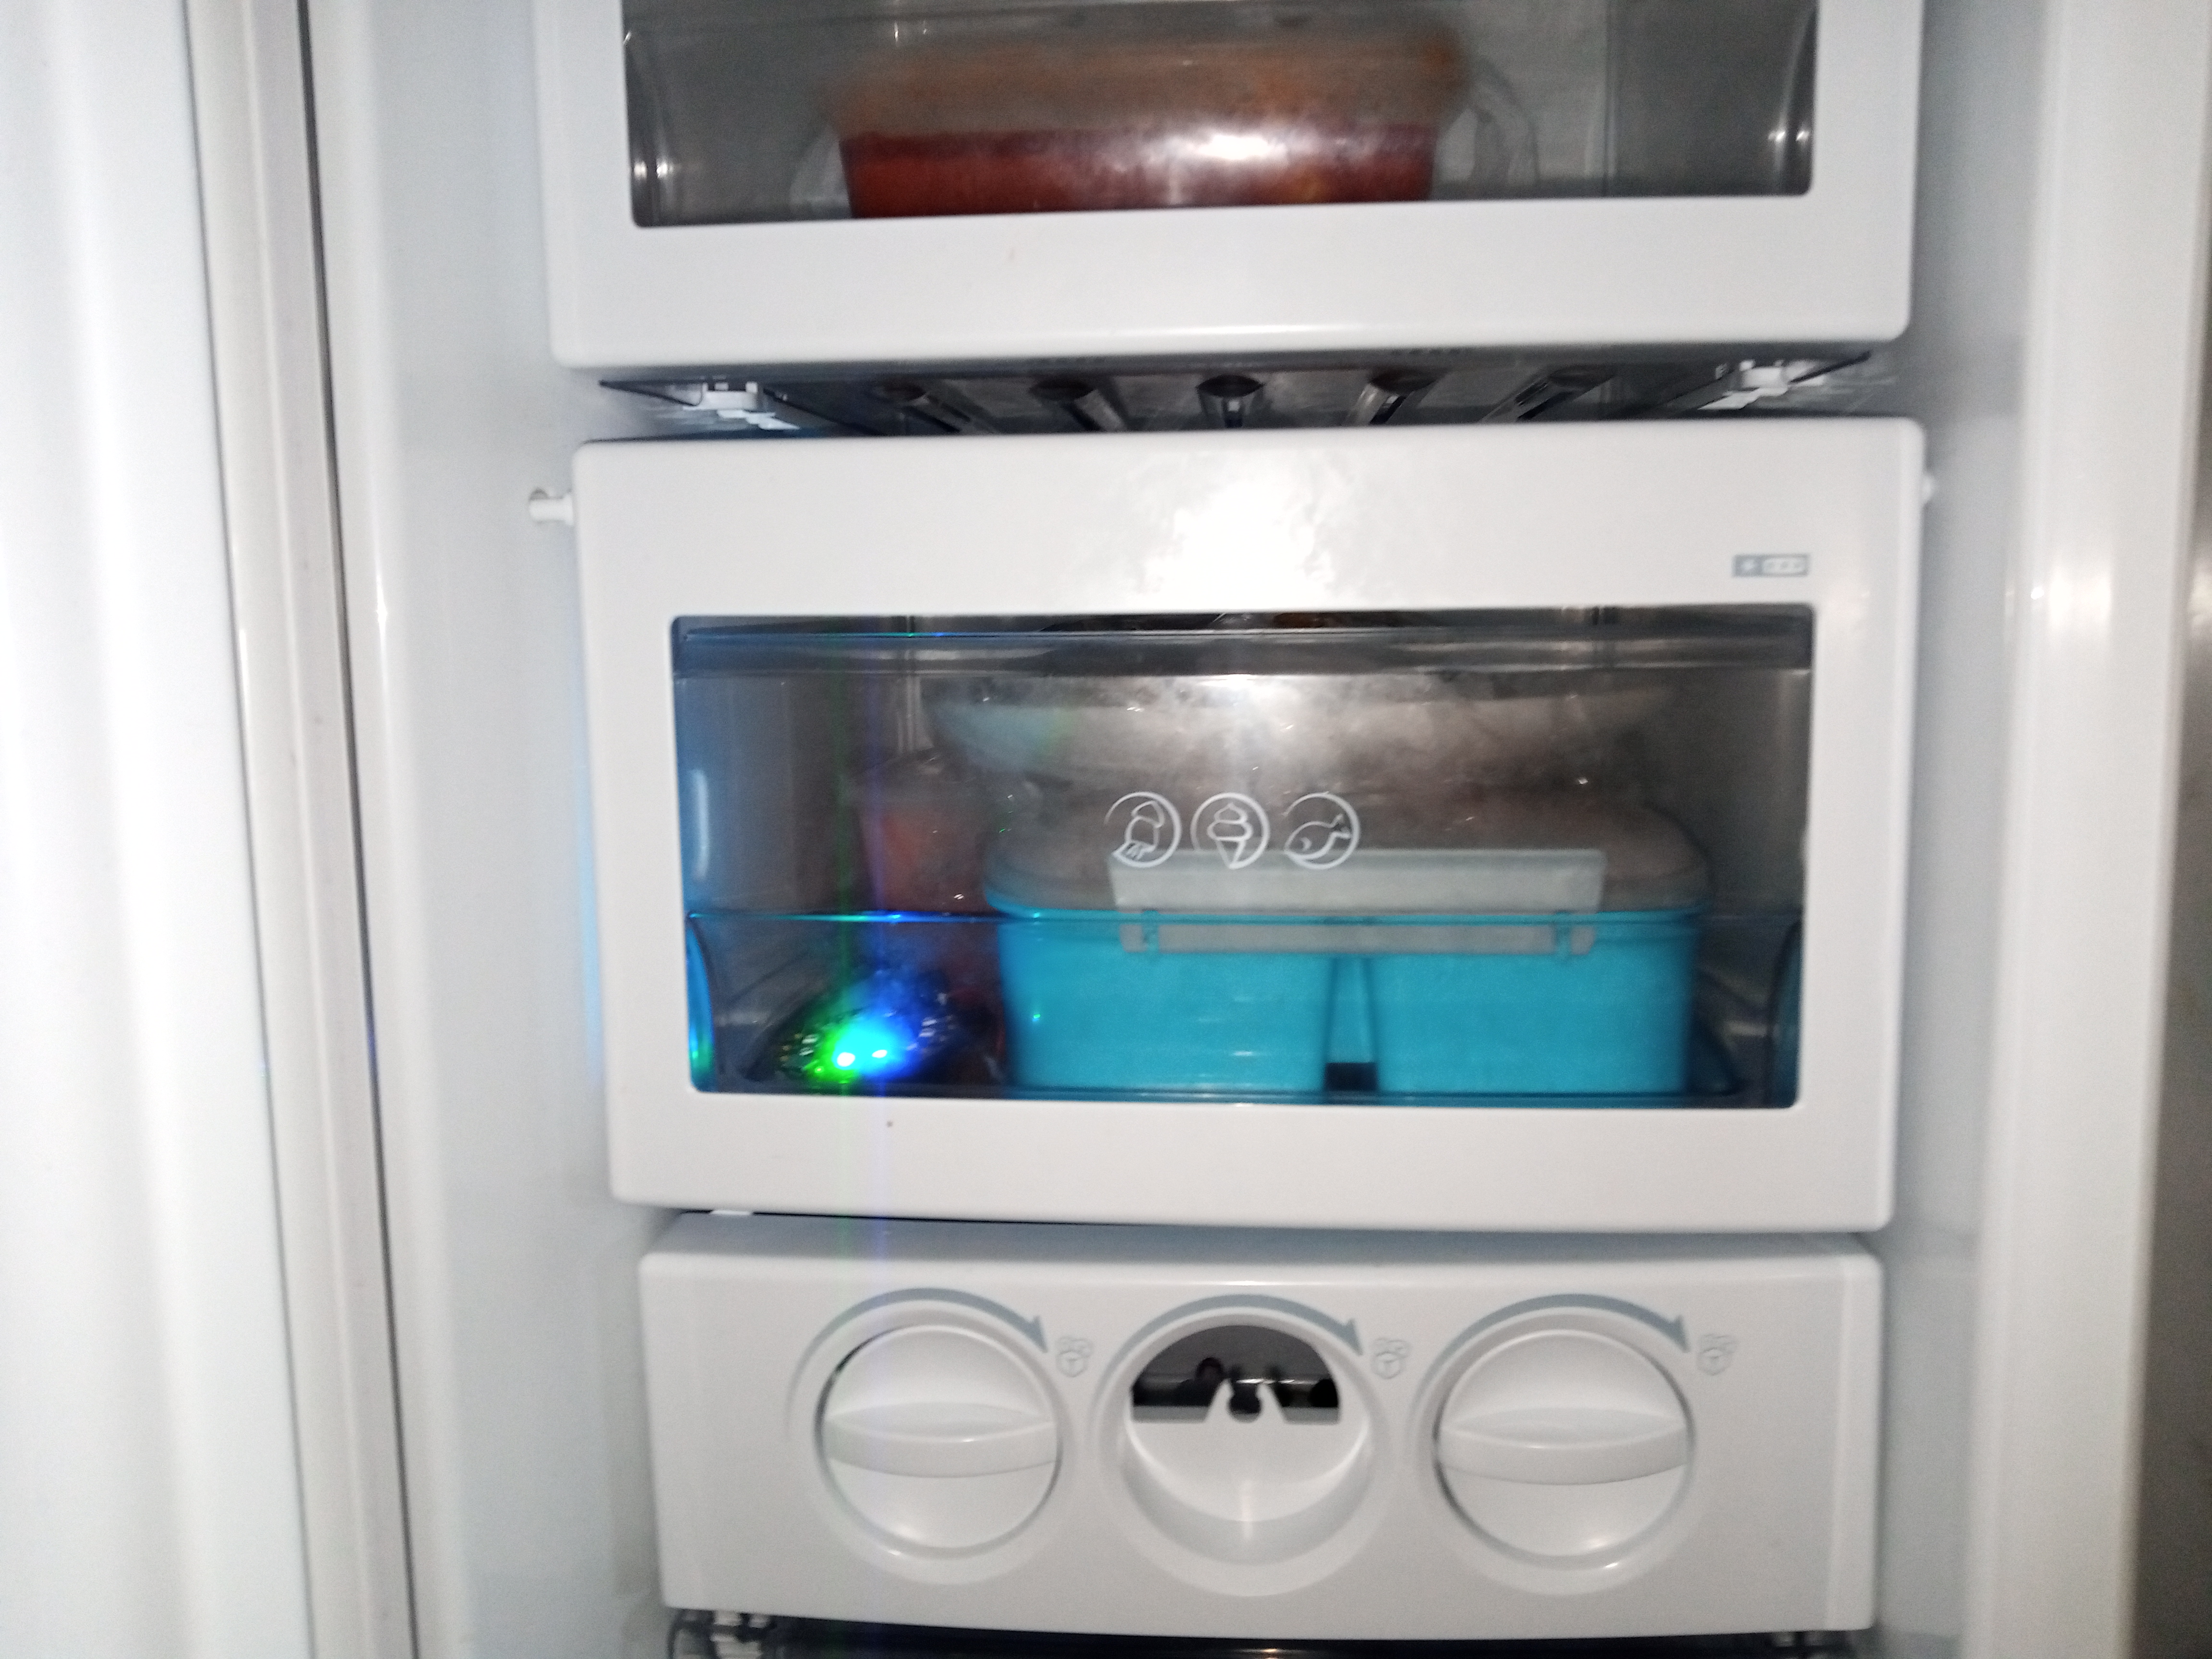
The experiment was conducted in an empty freezer because it is smaller (a more controlled environment) and cooler, and the temperature can easily be influenced compared to the bigger spaced fridge. The experiment was conducted in the freezer for approximately 1.5 hours during which the freezer was opened only 5 times. The first and last opening was to place the CPE in the freezer and to remove it at the beginning and the end of the experiment respectively, the 3 times it was opened in-between was to place new items in the freezer. The CPE was first placed in the empty freezer for 20mins at 13:30, so the CPE itself can cool to the fridge internal temperature and its temperature (which was the room temperature before it was in the fridge) won’t affect the internal temperature it records. Iteratively, after every 20 mins, the fridge is opened for 30secs to empty its content and place increasingly new items in it. Items were iteratively placed in the Fridge 4 times.
Assumptions Made
Since the only behavior of interest was how the number of items placed in the fridge affects the time it takes the fridge to cool, it was assumed that:
- The fridge’s current and power consumption is constant
- The time taken to insert items in the fridge is constant – ensured by opening the fridge for equal amount of time irrespective of the number of items involved.
- The base temperature of the fridge is constant throught the experiment
- The room temperature is constant throughout the experiment
- The items’ initial temperature is equal to the room temperature
Analyzing Observed Data
At the end of the experiment, only 360 temperature data was logged in the csv file - only the first 3 iterations was captured. The logged data is incomplete. The csv file was imported into Tableau for data analysis. The trend of the freezer’s temperature during the experiment is illustrated in the below figure. The chart begins with the thermistor recording the room temperature at 17.920C which dropped sharply (decreasingly) to the internal freezer temperature until it got to around 10C; after which the temperature slowly drops.
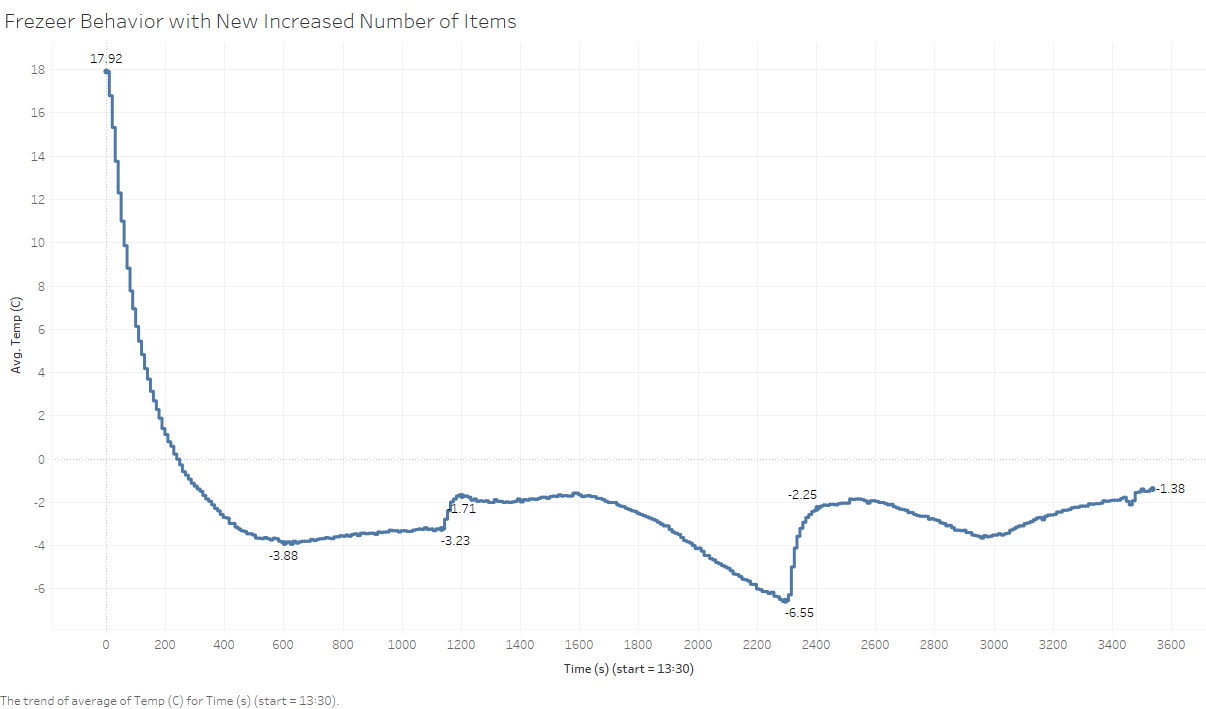
Interestingly, there is an observed rise in the freezer’s temperature approximately 1200s and 2400s which are approximately 20mins and 40mins respectively into the experiment – the times the freezer was opened for the iteration 2 and 3. It can also be observed that opening the freezer at both points for 30secs led to an increase in the internal temperature to approximately -1.70C and -2.20 C. The chart also shows that opening the freezer increases the temperature by a close range irrespective of the temperature of the freezer before it was opened. It can also be observed that it took approximately 7mins for the freezer to start experiencing a continuous decline in temperature after the first iteration, which appears to take a longer time in the second iteration.
Conclusions
From the chart above, it can be concluded that opening the Fridge results in lost of the Fridge's internal temperature. Also, considering the observed temperature of the fridge when it was opened the first and second time, it seems the number of items placed in the Fridge does not affect the time it takes the fridge to return to its base temperature. However, due to the incomplete nature of the data collected, conclusions about the system behavior cannot be drawn from the data. It will have been easier to recognize patterns in the system if the 4th iteration data wasa covered, since the first iteration was merely for placing the CPE in the fridge.
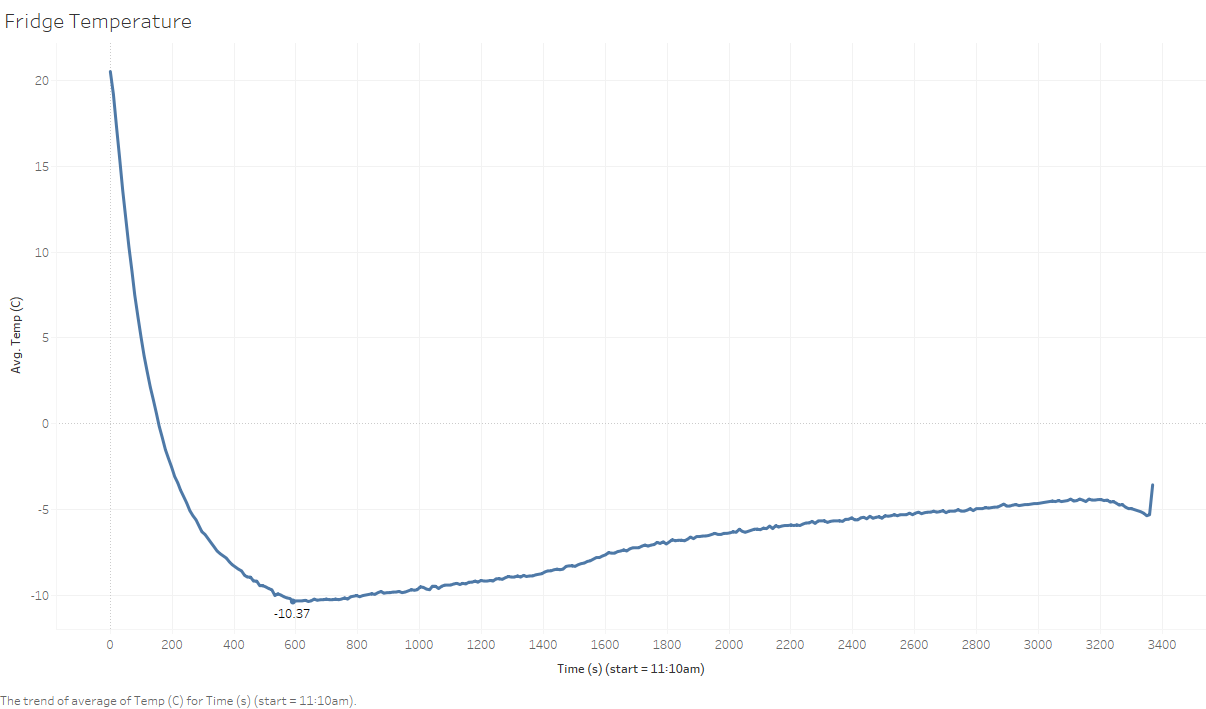
Prior to the main experiment, a trial experiment was conducted to observe how low the freezer’s temperature can get. The CPE was placed in the freezer for 56mins and a total of 344 datapoints were recorded. As shown in Fig 2 below, the logged temperature of the sensor started increasing after a temperature as low as 10.37 was recorded; this is an interesting behavior exhibited by the fridge. Does the CPE heat itself to regulate its temperature? Did someone else opened the fridge while I was away?
Challenges and Limitations
-
Modeling with CLDs: because CLDs can only have state variables in them, it bacame difficult to model variables that I thought are relevant to the system behavior but aren't state variables. Also, some of the relationships in the map are more complex than they appear which makes using stock and flow diagrams more suitable as it captures complex system dynamics better.
-
Incomplete entries: The CPE only recorded the freezer’s internal temperature in the first 1-hour in. This was due to the limitation in the Python code that it only records maximum of 360 entries in the sheet. Hence, only 1 of 1.5 hours of freezer’s internal temperature was recorded during the experiment
-
Logged Temperature accuracy: the CPE thermistor is an NTC thermistor (Murata NCP15XH103F03RC) with a 10K resistor connected to it as a pull down. This means the temperature measured by it may not the absolute temperature value.
-
Use of Proxy Time: The CPE can’t measure the exact time stamp as in dd/mm/yy MM:HH so time is measured as a function of the time difference in seconds between when the temperature was recorded and when the experiment started. The recorded times are approximations.
-
Inconclusiveness due to uncertainties in the environment: The lowest temperature observed was logged when the CPE was left in the freezer for a long time in the trial experiment. After which an increase in the temperature was observed even though I didn't open the fridge. However, because I wasn't present at that time, I couldn’t conclude if the observed behavior was caused by the fridge, or the sensor, or due to the fridge being opened by another person.
Takeaway Lessons
The list below enumerate what I've learned from this exercise and how I'd conduct experiments differently in the future based on the lessons learned.- One experiment is not enought to understand causalities or draw conclusions about systems with varying variables or experiments conducted in semi-controlled environment
- In future experiments, I will try to ensure other factors or variables aside those that are relevant to the research questions are eliminated or kept constant to avoid confusion about causalities, resulting in Inconclusiveness
- Keep track of start time and end time of experiments and their phases, especially in time sensitive experiment. I learned this from not noting the time in prior experiments, thereby making it difficult to make sense of the logged data; I needed to relate them to the time they were logged but I couldn’t.
- Conducting an experiment to test a hypothesis is an iterative process, the more experiments I conducted, the more refined the experiment design became. It is advisable to have a trial experiment before the main experiment
- Keep the experiments as simple as possible and isolate the experiment environment; making experiments unnecessarily complex only complicates it.
- Always document my decisions, actions, and their timestamp! in details.